Bitcoin is bullish above the 50-period SMA but is consolidating in a low-momentum market at about $98,000. A close above the immediate resistance at $99,900 can trigger the uptrend, targeting $101,900.
Bitcoin Technical Analysis – 5-January-2025
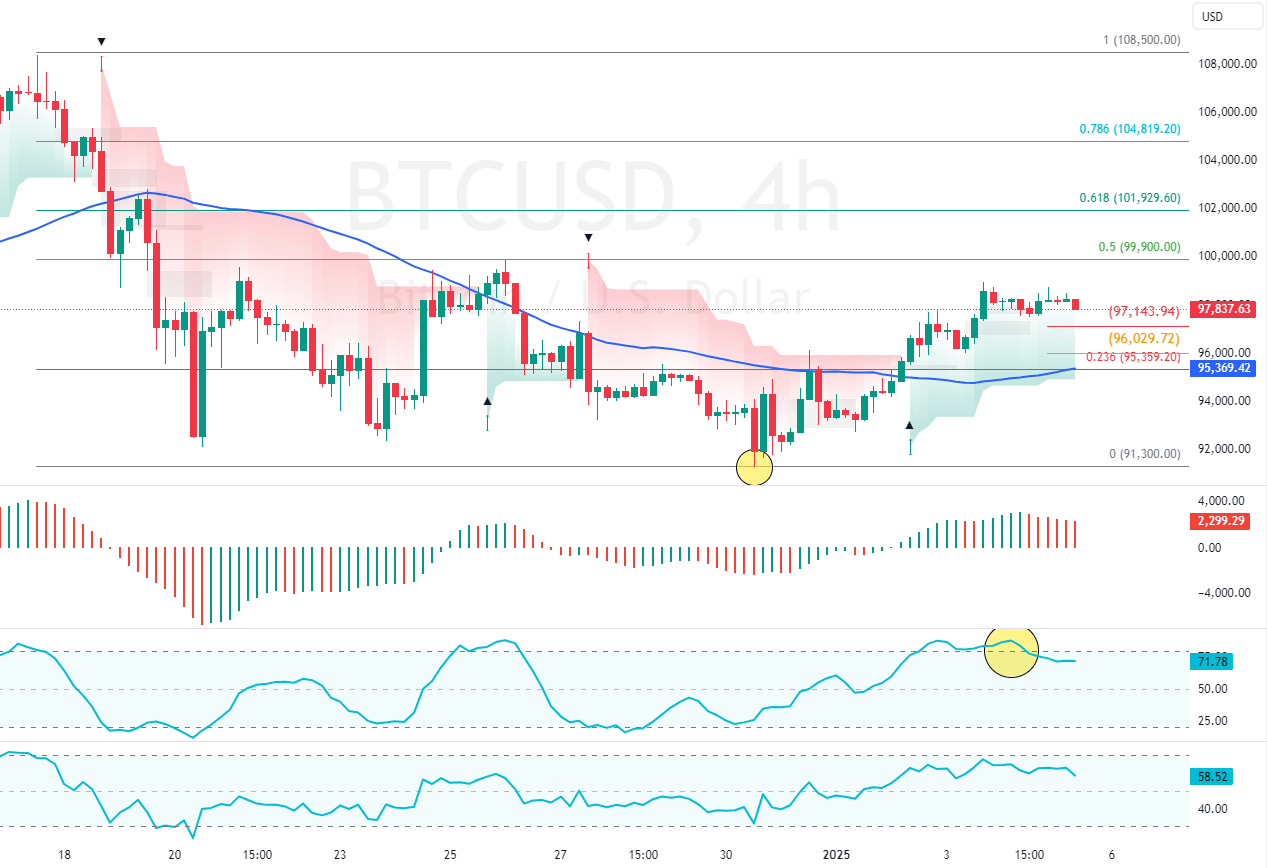
FxNews—The bearish wave in BTC/USD from $108,500 eased after the prices dropped to $91,300. Consequently, with the buyers’ push, the cryptocurrency flipped above the 50-period simple moving average and gained 7.0% since December 30, 2024.

As of this writing, BTC/USD trades at approximately $97,800, stabilizing above the 23.6% Fibonacci support level.
The Technical Indicators
- The RSI 14 depicts 58.0 in the description and is declining, meaning the bull market is weakened.
- The Stochastic Oscillator shows 71.0 in the description, stepping down from the overbought territory, indicating Bitcoin is not overpriced in the short term.
- The Awesome Oscillator histogram is red, above zero, and is interpreted as the bear market strengthening.
Overall, the technical indicators suggest that while the primary trend is bullish, BTC/USD has the potential to extend the consolidation toward lower support levels.
Bullish Bitcoin Consolidates At 98K: What’s Next?
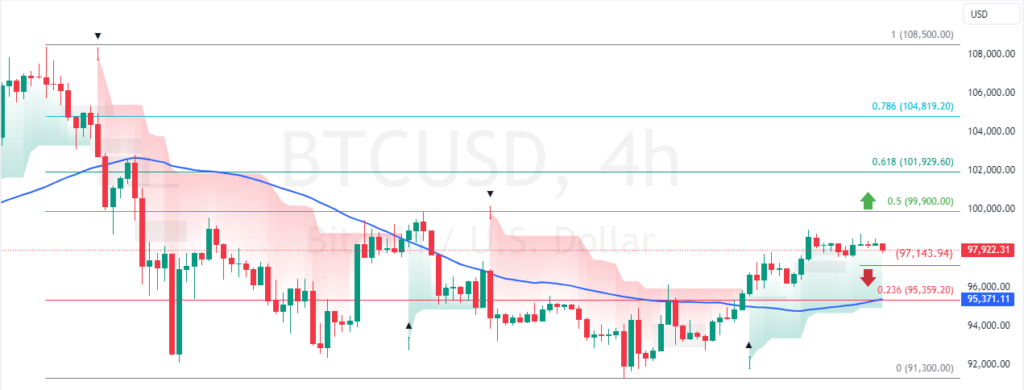
The immediate support is at $97,140. From a technical perspective, the consolidation phase could extend to lower support levels if bears (sellers) push Bitcoin below the immediate support.
If this scenario unfolds, the next bearish target could be testing the %23.6% Fibonacci support level at $95,360. Please note that this level can provide a decent bid to regroup with the buyers. Therefore, traders and investors should monitor this vital support closely for bullish signals, such as candlestick patterns.
- Bitcoin Analysis: Technical, Fundamental & News
- Litecoin Gained 7.1%: What’s the Next Target?
- Bitcoin is up 6.6% Amid Divergence Signals: What’s Next?
The Bullish Scenario
The immediate resistance is at $99,900. From a technical perspective, the uptrend from $91,300 will likely resume if Bitcoin’s value exceeds $99,900.
In this scenario, the next bullish target could be the %61.8 Fibonacci resistance level at $101,900.
Bitcoin Support and Resistance Levels – 5-January-2025
Traders and investors should closely monitor the BTC/USD key levels below to make informed decisions and adjust their strategies accordingly as market conditions shift.
| Bitcoin Support and Resistance Levels – 5-January-2025 | |||
|---|---|---|---|
| Support | $97,140 | $95,360 | $91,300 |
| Resistance | $99,900 | $101,900 | $104,800 |


