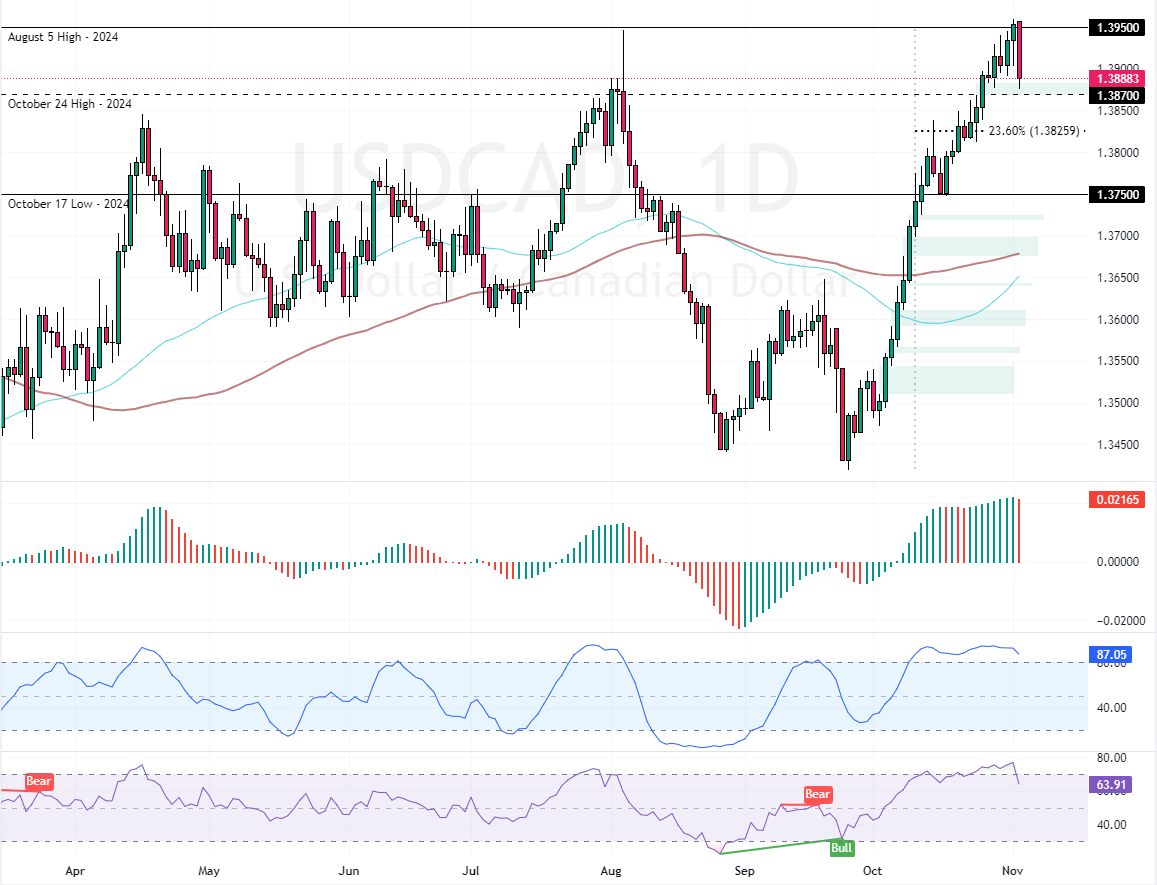
FxNews—The U.S. Dollar started dipping against the Canadian dollar when the price peaked at 1.395, the August 5 high. This drop was expected because the Stochastic Oscillator has been signaling overbought since October 10.
As of this writing, the USD/CAD currency pair trades at approximately 1.387, filling the Fair Value Gap. The daily chart below demonstrates the price, key support and resistance levels, and the technical indicators utilized in today’s analysis.

USDCAD Technical Analysis – 4-November-2024
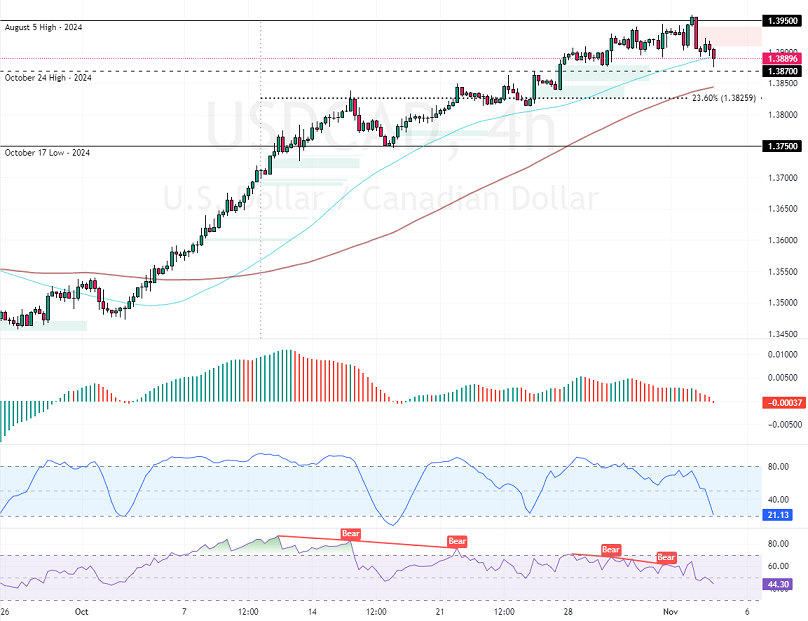
Zooming into the 4-hour chart, we notice that despite the recent sharp decline from the 1.395 critical resistance level, the USD/CAD price is still above the 100-period simple moving average, meaning the main trend is bullish.

On the other hand, the Awesome Oscillator flipped below the signal line, indicating that the bear market is strengthening. Furthermore, the Stochastic Oscillator flipped below 20, depicting 18 in the description, meaning the Canadian dollar is overpriced in the short term.
Overall, the technical indicators suggest that while the primary trend is bullish, the current downtrend could be in the consolidation phase.
USDCAD Forecast – 4-November-2024
The October 24 high at 1.387 is the immediate support. From a technical perspective, the current consolidation phase could extend to the 23.6% Fibonacci retracement level if USD/CAD dips below that mark.
If this scenario unfolds, the next critical support area will be 1.382, backed by the 100-period simple moving average.
Furthermore, if the selling pressure pushes USD/CAD below 1.382, the dip could spread to the October 17 low at 1.375.
USDCAD Bullish Scenario
The bullish market will likely resume If bulls (buyers) close and stabilize the price above the 1.395 critical resistance, the August 5 high. If this scenario unfolds, the next bullish target could be the 1.40 mark.
USDCAD Support and Resistance Levels – 4-November-2024
Traders and investors should closely monitor the key levels below to make informed decisions and adjust their strategies accordingly as market conditions shift.
- Support: 1.387 / 1.375
- Resistance: 1.395 / 1.40