FxNews—In October, the Canadian dollar fell to its lowest point in nearly two months, trading close to 1.37 against the U.S. dollar.
Canada’s trade deficit increased significantly in August, reaching CAD 1.10 billion, up from CAD 0.29 billion in July. This deficit, much larger than the anticipated CAD 0.5 billion, is the biggest since May.
The increase resulted from a 1% decrease in exports, including a 3% reduction in energy products. Notably, crude oil exports, Canada’s primary export product, declined by 4.1%.
Challenges in the Energy Sector
The energy sector experienced additional stress as crude oil prices dropped, influenced by insufficient economic incentives from China, the world’s leading importer. This downturn puts further pressure on Canada’s export-driven economy.
Anticipation of Labor Market Data
Market observers are keenly awaiting new labor market data, which is expected to reveal more weaknesses.
Meanwhile, the U.S. dollar gained strength due to expectations that the Federal Reserve might not be as accommodating as previously thought. The demand for the U.S. dollar as a safe investment also grew, adding more pressure to the Canadian dollar.
USDCAD Technical Analysis – 9-October-2024

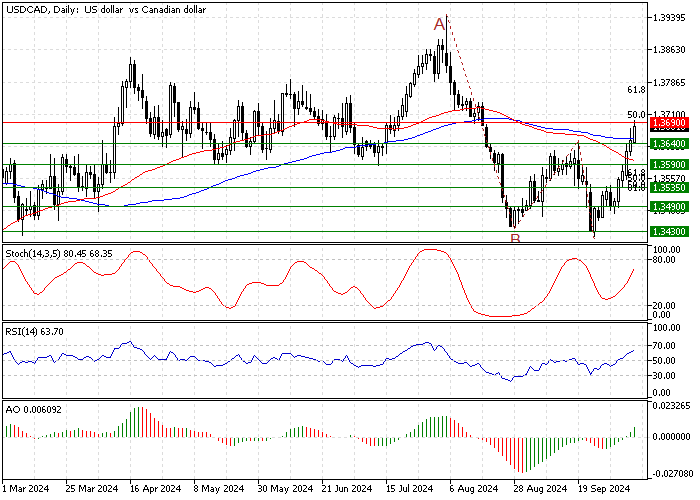
FxNews—The USD/CAD bullish trend reached the %50 Fibonacci retracement level of the A.B. wave at 1.369. The daily chart below shows the price and the critical support and resistance levels.

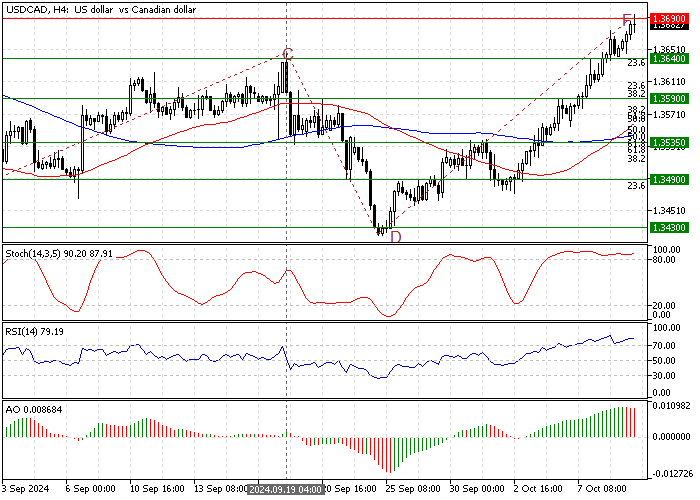
Zooming into the 4-hour chart, we notice that strong buying pressure caused the USD/CAD pair to become overbought.
The Stochastic oscillator records 90 in the description, backed by the RSI 14, which shows 78. This development in the technical indicators suggests the Canadian dollar has the potential to erase some of its recent losses against the U.S. dollar.
USDCAD Forecast – 9-October-2024

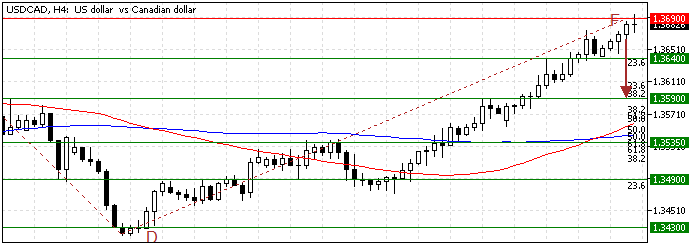
It is not advisable to join a bull market when it is overbought. Hence, we expect the USD/CAD price to dip from the 1.369 resistance and aim toward the 1.364 (September 19 Low) support.
Furthermore, if the selling pressure exceeds 1.365, the consolidation phase can extend to the %38 Fibonacci retracement level of the DF wave at 1.359. This level of support offers a decent bid to join the bull market.
USDCAD Support and Resistance Levels – 9-October-2024
Traders and investors should closely monitor the key levels below to make informed decisions and adjust their strategies accordingly as market conditions shift.
- Support: 1.364 / 1.359 / 1.353
- Resistance: 1.369 / 1.373 / 1.377