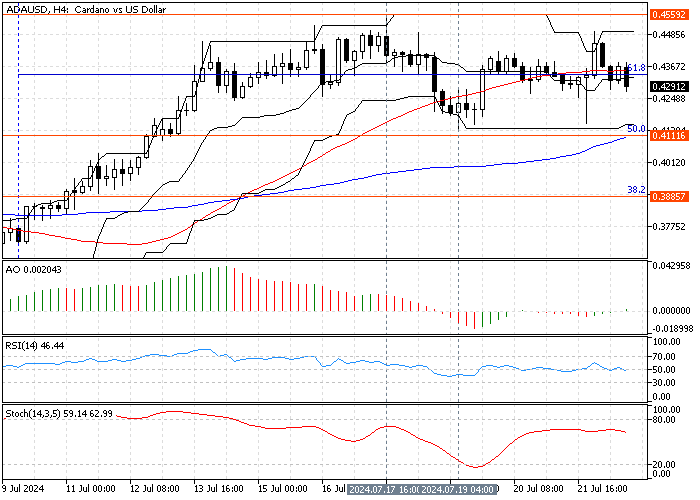
FxNews—Cardano trades sideways between the July 17 high at $0.455 and the July 19 low at $0.411. As of writing, the ADA/USD crypto pair trades at approximately $0.428.
The Cardano 4-hour chart below demonstrates today’s price, the key Fibonacci levels, and the technical indicators utilized in today’s analysis.

Cardano Analysis – 22-July-2024
The primary trend is bullish because the price is above the 100-period simple moving average and the $0.413 key resistance level. In addition to the 100 SMA, the price constantly flips around the 50-period simple moving average, indicating market direction uncertainty.
Other technical indicators in the 4-hour chart also give mixed signals, signifying a low momentum market but mildly bullish.
Cardano Forecast – 22-July-2024

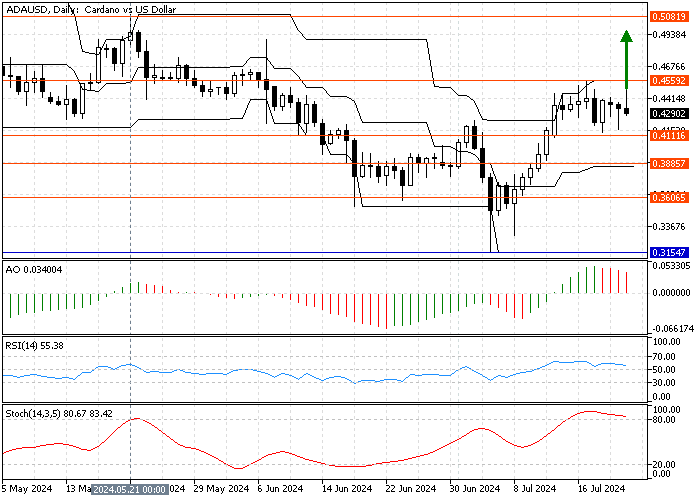
As mentioned earlier, the primary trend is bullish. However, for the bull market to resume, buyers must close and stabilize the price above the July 17 high at $0.455. Cardano’s price could target the May 21 high at $0.508 if this scenario unfolds.
Please note that the %50 Fibonacci at $0.411 is the key resistance level. The bull market should be invalidated if the price dips below $0.411.
- Read also: Ripple Technical Analysis – 22-July-2024
Cardano Bearish Scenario – 22-July-2024

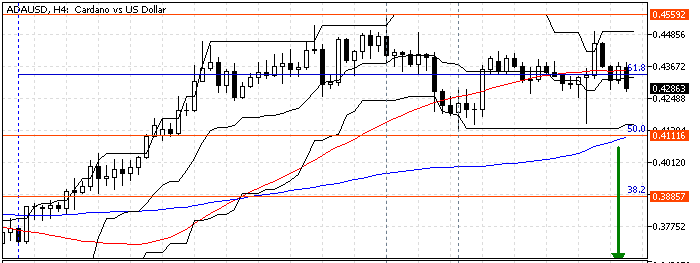
The 100-period simple moving average neighbors the July 19 low at $0.411, which is the pivot between the bull and the bear markets. If the ADA/USD price closes and stabilizes below the $0.411 mark, it could dip further to the next resistance level at $0.388, the 38.2% Fibonacci.
Furthermore, if the selling pressure exceeds $0.388, the seller’s road to the 23.6% Fibonacci at $0.360 will be paved.
Cardano Key Levels – 22-July-2024
Traders and investors should closely monitor the key levels below to make informed decisions and adjust their strategies accordingly as market conditions shift.
- Support: $0.411 / $0.388 / $0.360
- Resistance: $0.455 / $0.508
Disclaimer: This technical analysis is for informational purposes only. Past performance is not necessarily indicative of future results. Foreign exchange trading carries significant risks and may not be suitable for all investors. Always conduct your research before making any investment decisions.