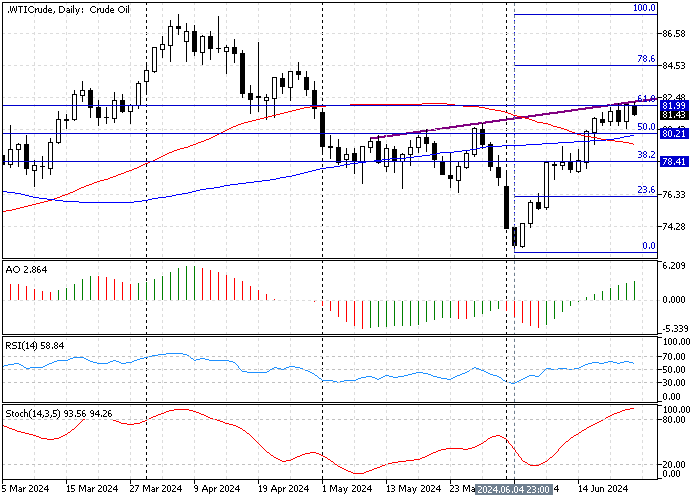
FxNews—The Oil market is in a robust uptrend, trading at approximately $81.4 per barrel. The bullish wave that began on June 4 eased in today’s trading session after the Crude Oil price reached the 61.8% Fibonacci retracement level at $81.9. This robust uptrend caused the stochastic oscillator to step into overbought territory and remain there since June 19.
The Crude Oil daily chart below demonstrates the key Fibonacci levels and the technical indicators utilized in today’s technical analysis.

Crude Oil Technical Analysis – 25-June-2024
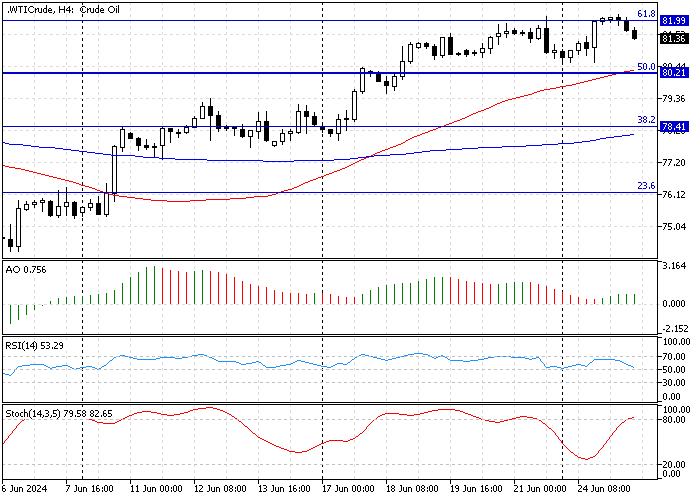
We zoom into the Crude Oil 4-hour chart for a detailed analysis and find key levels and trading opportunities. The diagram below shows the price is returning from the 61.8% Fibonacci retracement level at $81.9. At the same time, the stochastic oscillator in the 4-hour chart has just crossed the 80 line and jigged into the overbought territory.

- The awesome oscillator bars are green and above the zero line, recording 0.75 in the description. This growth in the AO value suggests the bull market prevails.
- The relative strength index indicator value is declining, signifying that the bullish market is losing momentum. Therefore, the crude oil market might begin a consolidation phase extending to the lower resistance levels.
These developments in the technical indicators in the Crude Oil 4-hour chart suggest the primary trend is bullish, but Oil might be overpriced.
Crude Oil Price Forecast – 25-June-2024

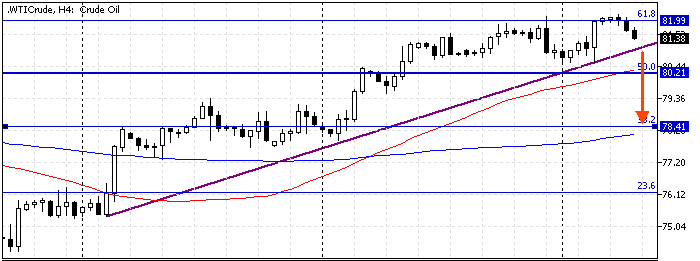
The primary trend is bullish, with the immediate resistance level at $81.0, backed by the ascending trendline. Notably, the awesome oscillator in the 4-hour chart shows signs of divergence.
Hence, from a technical standpoint, the crude oil price is overbought and might be consolidated soon. If the Oil price dips below the ascending trendline at approximately $81, the price will likely decline to the 50-period simple moving average at approximately $80.2, backed by the 50% Fibonacci. Furthermore, if the selling pressure exceeds $80.2, the next bearish target could be the 38.2% Fibonacci at $78.4.
The 81.9$ is the key resistance to this scenario; if this level is breached, the consolidation scenario should be invalidated.
Crude Oil Bullish Scenario
If the Crude Oil price stabilizes above the 61.8% Fibonacci at $81.9, the uptrend could resume, and the next bullish target will likely be $83.2.
The 50-period simple moving average supports the bullish scenario, and if the price crosses below it, the bullish analysis should be invalidated accordingly.
- Next read: Crude Oil Technical Analysis – 17-July-2024
Crude Oil Key Support and Resistance Levels
Traders and investors should closely monitor the key levels below to make informed decisions and adjust their strategies accordingly as market conditions shift.
- Support: $80.2 / $78.4
- Resistance: $81.9 / $83.2