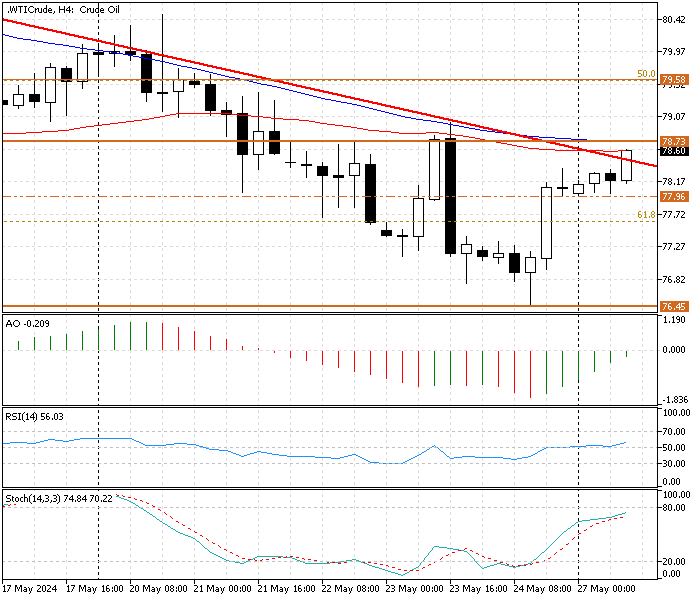
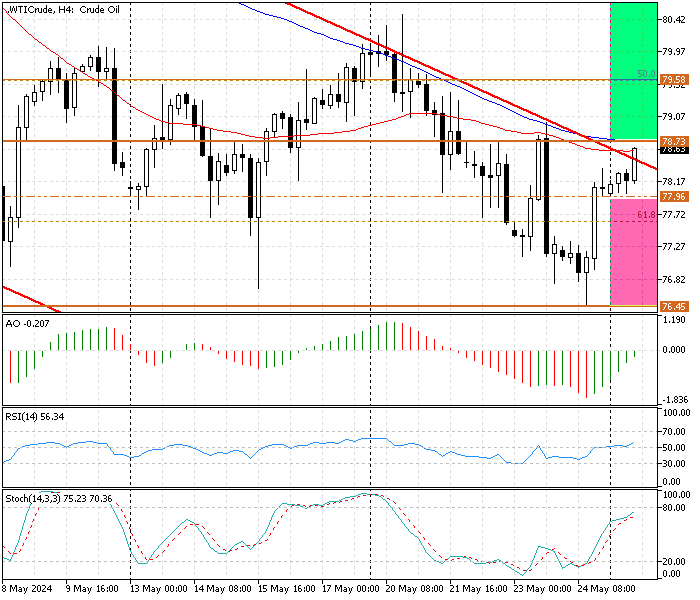
FxNews—WTI Crude Oil has been trading bearishly since March 5. As of this writing, the price is testing the descending trendline at about $78.5.
Crude Oil Technical Analysis – May-27-2024 (Daily Chart)

The Crude Oil daily chart above shows that black gold bounced from the $76.4 resistance level on Friday, while the technical indicators signal a continuation of the downtrend.
- The awesome oscillator value is -2.9, and the bars are below the signal line and red, suggesting a bearish trend prevails.
- The relative strength index value is 43, hovering below the median line, showing a downtrend market.
- The stochastic oscillator is not in overbought or oversold territory. The indicator shows 36 in the %K line, meaning the Oil market might lose momentum soon.
These developments in the technical indicators, combined with the fact that the pair trades in the bearish flag, suggest the primary trend is bearish, and traders and investors should seek to join the prevailing downtrend.
Crude Oil Technical Analysis – May-27-2024 (4-Hour Chart)

The 4-hour chart provides a detailed outlook of the price action and the technical indicator. As mentioned, the bulls are testing the descending trendline at about $78.5. This resistance level is backed by a simple moving average of 50 and 100, which adds credit.
The technical indicators in the 4-hour chart give exciting signals.
- The RSI (14) has just flipped above the middle line, hovering around 56, signifying the bullish trend.
- The awesome oscillator value is -0.2 and rising while the bars are green, yet it is floating below the signal line.
- The stochastic oscillator value is 74, and the %K line approaches the overbought territory. This growth in the indicator suggests the market might become overbought soon.
These developments in technical indicators in the Crude Oil 4-hour chart suggest the market can become bullish in the short term. The bulls might break above the key resistance, which is EMA 50 and 100 at $78.7.
WTI Crude Forecast – The Bearish Scenario

The stochastic oscillator with 14.3.3 in the settings is not overbought, the same as RSI (14). But, the $78.7 immediate resistance is backed by SMA 50 and 100, which can pause the uptick momentum.
For the downtrend to resume, the bears must maintain the price below the $78.7 resistance. In addition, selling pressure must exceed the immediate support at $77.9. If this scenario occurs, the market can dip to May’s low of $76.4.
WTI Crude Forecast – The Bullish Scenario
On the other hand, the oil price faces strong resistance at $78.7, and the technical indicators in the 4-hour chart suggest this level might not hold the buying pressure for so long.
That said, if the Oil price closes and stabilizes above the immediate resistance ($78.7), the pullback initiated on Friday will likely target the 50% Fibonacci retracement level at $79.5. A further push can lead the price to aim for the 38.2% Fibonacci at $81.5.
- Next read: Crude Oil Technical Analysis – 4-June-2024
WTI Crude Oil Key Support and Resistance
Traders and investors should closely monitor the key levels below to make informed decisions and adjust their strategies accordingly as market conditions shift.
- Support: $77.9, $76.4
- Resistance: $78.3, $79.5, $81.5