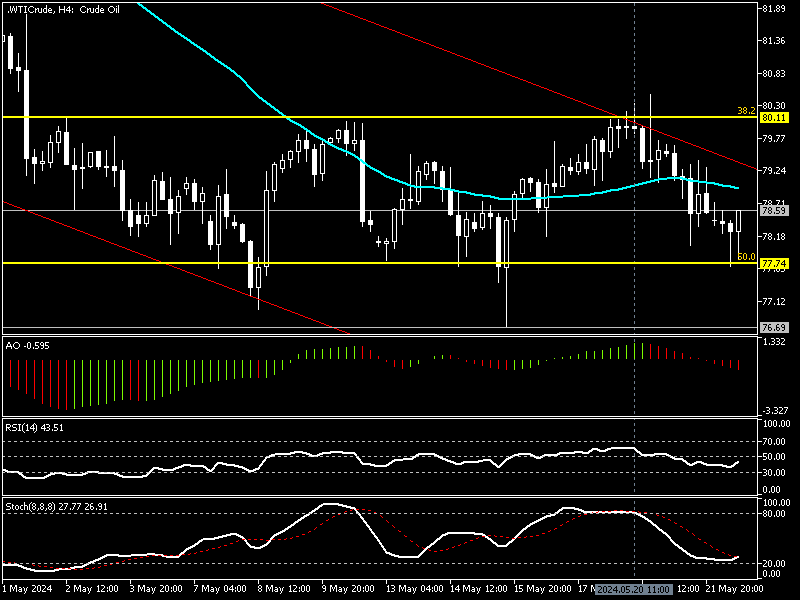
FxNews—The WTI crude oil returned bearish from the $80.1 immediate resistance, a barrier backed by the % 38.2 Fibonacci retracement level.

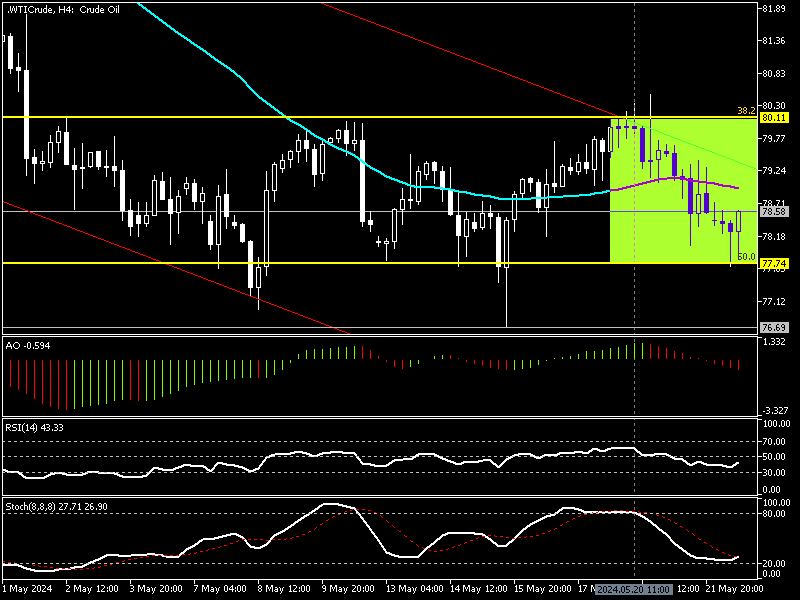
The selling pressure flipped the Oil price below EMA 50, and as of writing, the black gold trades at about $78, bouncing from the 50% Fibonacci level. The %50 Fibonacci is the immediate support at $77.7, a strong barrier that paused the Oil price to dip further, or at least for now.
We notice a hammer candlestick pattern in the WTI Crude 4-hour chart. This was due to the price hitting the immediate support, and as a result, the Oil price is experiencing a pullback from $77.7.
Oil May Recover Before Bear Market Resumes

The technical indicators suggest that the bear market will resume. The awesome oscillator bars are red, hovering below the signal line and recording -0.60 in the histogram.
The relative strength index (RSI 14) floats below the median line, depicted as 40 in the description. On the other hand, the stochastic oscillator demonstrates bullish momentum with the %K line value at 26, which is logical because the price is pulling back from immediate support.
These developments in the technical indicators in the oil 4-hour chart suggest that the bear market is prevailing. Still, The price of oil might erase some of its recent losses against the U.S. dollar before the downtrend resumes.
- Also read: Crude Oil Technical Analysis – May-27-2024
Bearish Flag Since Mid-April Confirmed

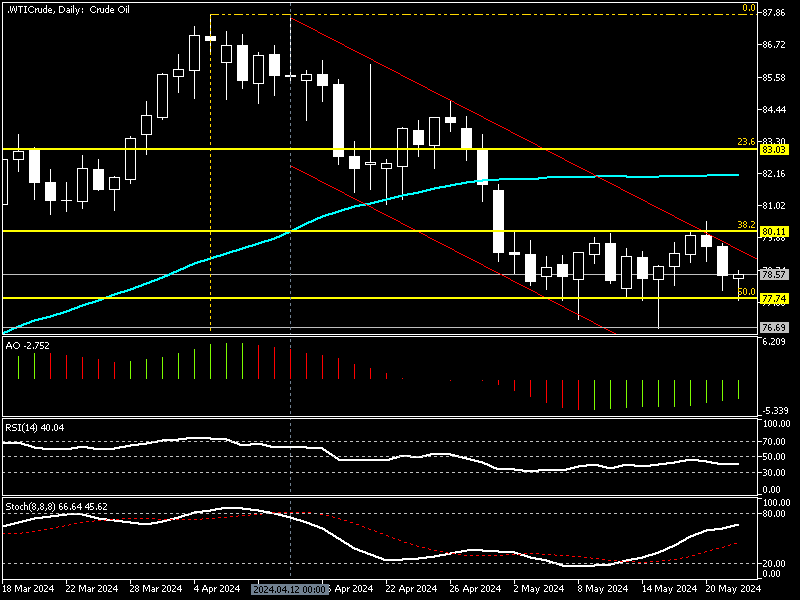
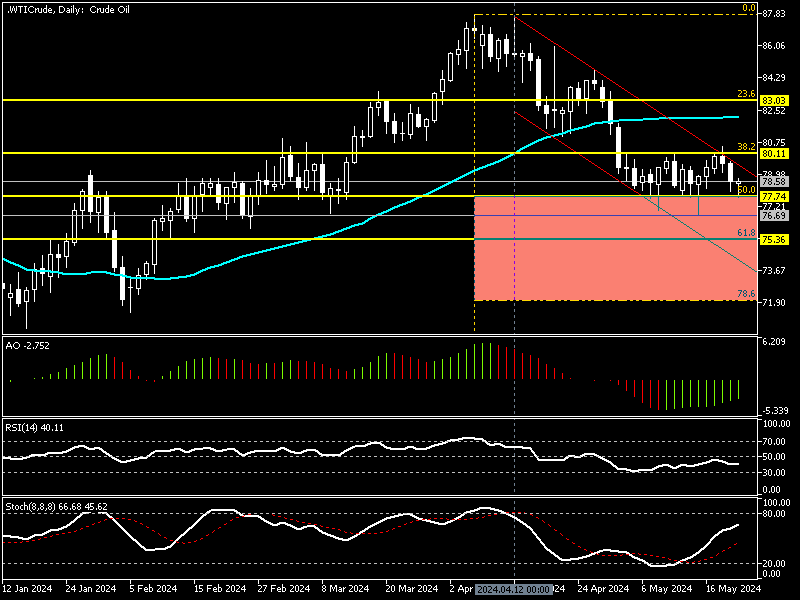
Another interesting fact is that the market has been on a bearish flag since mid-April, as shown in the daily chart below. This adds credit to the downtrend. Therefore, traders and investors should seek opportunities to join the primary trend, which is bearish.
Crude Oil Technical Analysis – Potential Dip to $76.6

From a technical standpoint, for the downtrend to resume, the price must close and stabilize below the immediate support at $77.7. If this scenario comes into play, the selling pressure will likely escalate. As a result, the price of oil could dip to $76.6, followed by 61.8% of Fibonacci at $75.3.
The Bullish Scenario
As mentioned earlier in this Oil technical analysis, immediate support is at $77.7, or the 50% Fibonacci retracement level. If the Oil price maintains its position above $77.7, the current pullback might extend to the descending trend line, followed by May’s peak at $80.1.
Should the bulls break out from this level, the bearish outlook must be invalidated, and the road to the 23.6% Fibonacci at $83.0 could be paved.
WTI Crude Oil Support and Resistance Levels
Traders and investors should closely monitor the key levels below to make informed decisions and adjust their strategies accordingly as market conditions shift.
- Support: $77.7, $76.6, $75.36
- Resistance: $80.1, $80.0