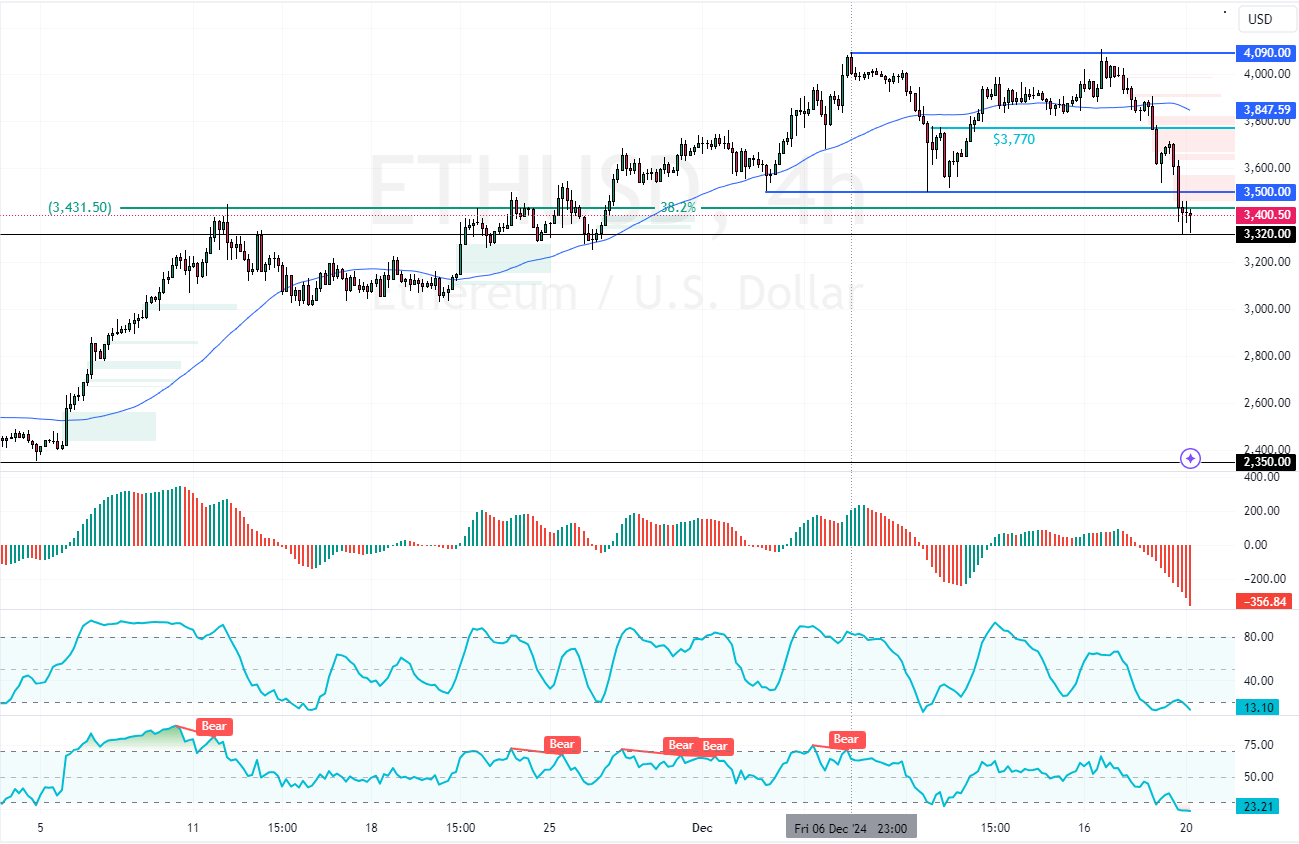
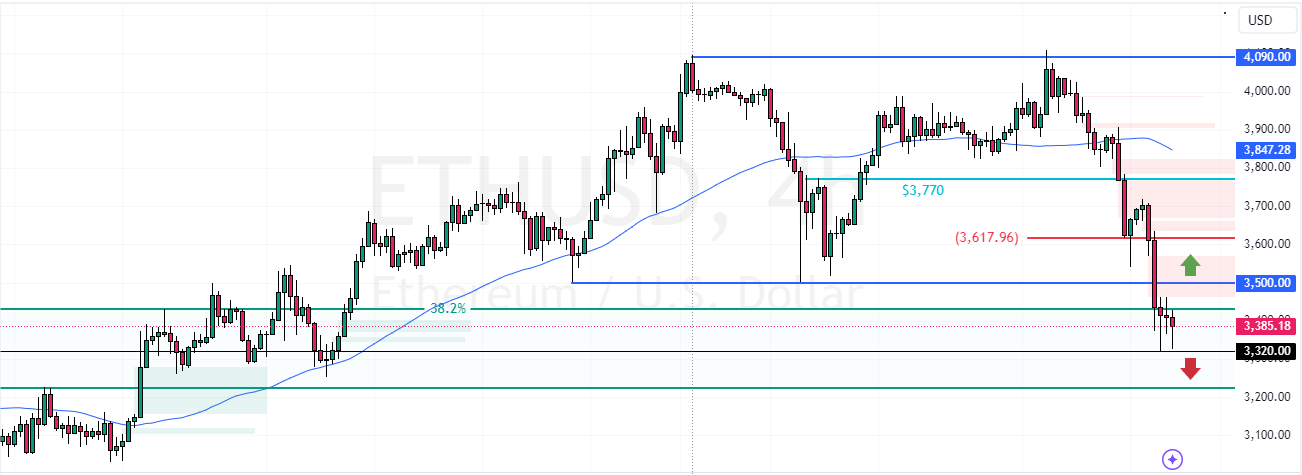
Ethereum tests the 38.2% Fibonacci level, a critical resistance level, amid RSI 14 and Stochastic hinting at an oversold market. If bulls pull ETH above $3,500, the price could pull back from $3,400.
Please note that the downtrend could resume if bears push the prices below $3,320, which is the December 19 low.

Ethereum Technical Analysis – 20-December-2024
ETH/USD turned bearish after the prices failed to surpass the December 6 high at $4,090. Consequently, the selling pressure increased, and the cryptocurrency dipped below the 50-period simple moving average.
As of this writing, Ethereum trades bearish at approximately $3,400, losing 0.3% of its value.
Furthermore, the Awesome Oscillator histogram is red and below zero, meaning the bear market prevails. On the other hand, RSI 14 and Stochastic records show 23 and 13, respectively, which interprets as an oversold Ethereum.
Therefore, ETH has the potential to pull back from the current price or lower, targetting upper resistance levels.
ETH Price Nears Decision Point

The immediate resistance rests at $3,500. From a technical perspective, a new consolidation phase could be formed if Ethereum buyers pull the prices above that resistance. In this scenario, the market prices could rise toward $3,617.
- Good read: Solana Down %5.0 Testing $182 Key Resistance
The Bearish Scenario
The immediate support is at $3,320. If bears push Ethereum below this level, the downtrend will likely resume.
If this scenario unfolds, the next bearish target could be $3,200.


