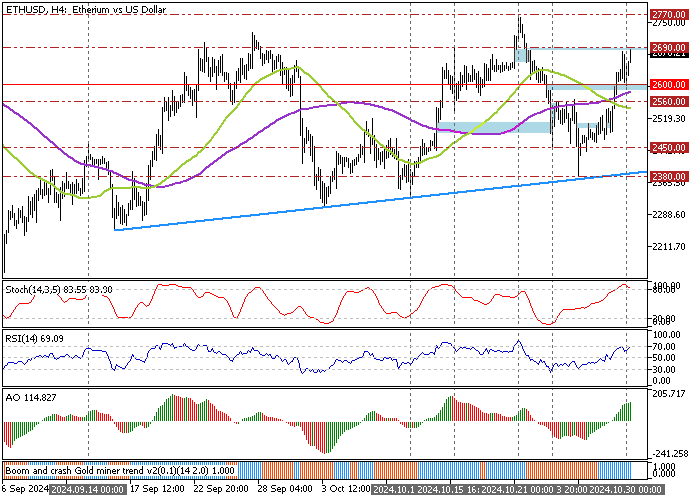
FxNews—Ethereum trades in a bull market above the 50- and 100-period simple moving averages. As of this writing, ETH/USD trades at approximately $2,690, poised to break the October 15 high.
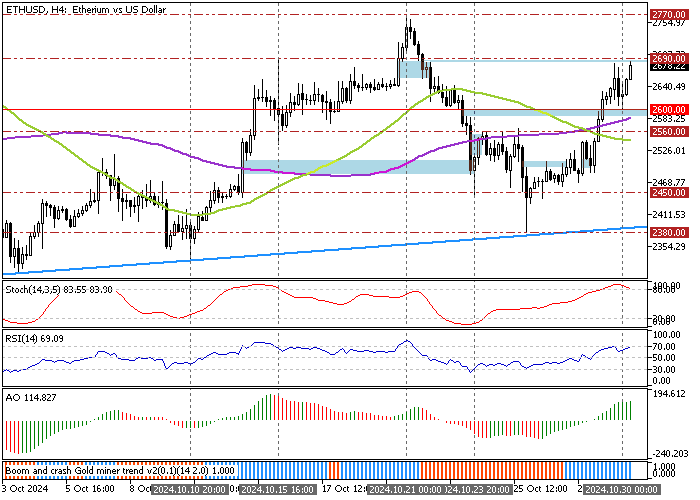
The 4-hour price chart below demonstrates the price, support, resistance levels, and technical indicators used in today’s analysis.

Ethereum Technical Analysis – 30-October-2024
Robust buying pressure has driven the Stochastic oscillator into overbought territory, depicting 83 in the description. Concurrently, the Relative Strength Index indicator nears 70, backing the Stochastic overbought signal.

On the other hand, the primary trend is bullish as the Awesome Oscillator histogram is green and above the signal line.
Overall, the technical indicators suggest the primary trend is bullish and should resume after a minor price consolidation.
Ethereum Price Forecast – 30-October-2024

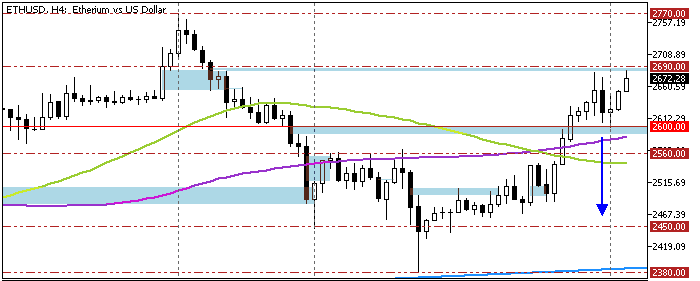
The immediate support is at $2,600, which bears tested in today’s trading session. Consequently, the bullish momentum resumed, and the price aimed to break the $2,690 immediate resistance.
From a technical perspective, the uptrend will likely resume if bulls close above the $2,690 resistance. The next bullish target in this scenario could be the October 21 high at $2,770.
Please note that the $2,600 support backs the bullish scenario, and it should be invalidated if ETH/USD dips below it.
- Next good read: Bitcoin Hits 2024 High as Momentum Hints at Overbought
Ethereum Bearish Scenario

If bears (sellers) push the price below the $2,600 support, backed by the 100-period simple moving average, the Ethereum price will likely suffer more losses, which could lead to $2,560 followed by the $2,450 (September 14 High) support.
Ethereum Support and Resistance Levels – 30-October-2024
Traders and investors should closely monitor the key levels below to make informed decisions and adjust their strategies accordingly as market conditions shift.
- Support: 2,600 / 2,560 / 2,450
- Resistance: 2,690 / 2,770