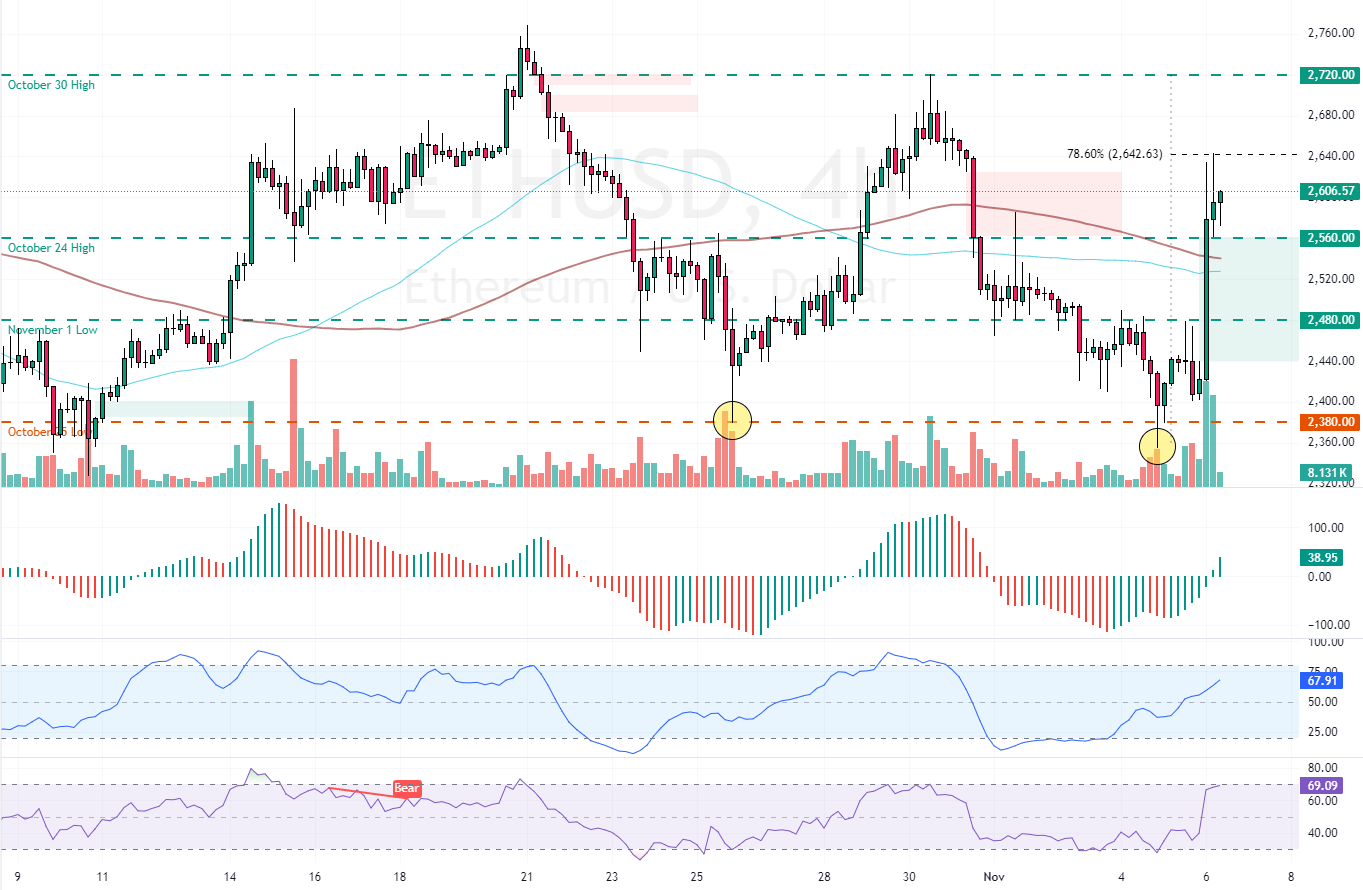
FxNews—Ethereum formed a double bottom pattern, as mentioned in our previous analysis. The pattern resulted in the price breaking from the $2,480 immediate resistance and surpassing the $2,560. As of this writing, ETH/USD stabilizes above the $2,560 critical resistance, coinciding with the 100-period simple moving average.
As for the technical indicators, the RSI and Stochastic have not been overbought yet, meaning the uptrend can resume. Furthermore, the Awesome Oscillator histogram flipped above the signal line, suggesting the bull market should prevail.

Ethereum Holds $2,560 Support Could Aim for $2,720 Next
From a technical perspective, immediate support rests at $2,560. As long as this support stands still, the outlook for the ETH/USD trend should be bullish. However, for the bull market to resume, the Ethereum price should exceed the 78.6% Fibonacci retracement level at $2,640. In this scenario, the next target could be the October 30 high at $2,720.
Conversely, a new consolidation phase could emerge if bears push the price below the $2,560 immediate support. If this scenario unfolds, ETH/USD would probably begin a new consolidation phase that could fill the fair value gap at approximately $2,480, the November 1 low.
- Support: 2,560 / 2,480 / 2,380
- Resistance: 2,640 / 2,720