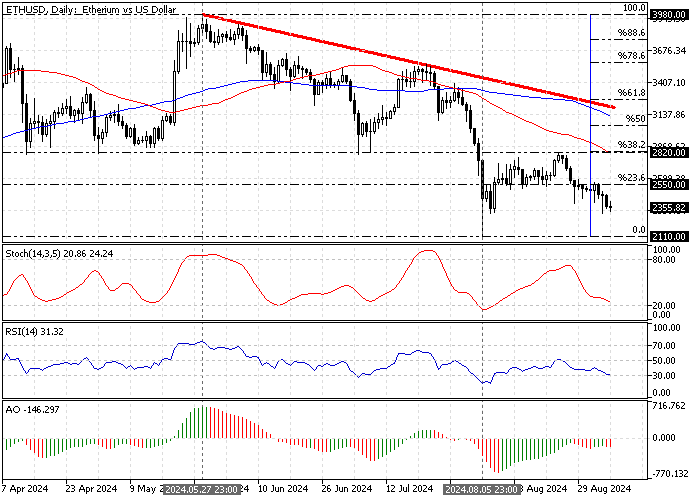
FxNews—Ethereum has been a downtrend since May 27, when it reached the $3,980 high. The downtrend eased on August 5 at $2,110. As of this writing, the ETH/USD pair trades bearish below the %23.6 Fibonacci level at approximately $2,350.
The daily chart below demonstrates the price, Fibonacci retracement levels, and the indicators utilized in today’s technical analysis.

Ethereum Technical Analysis – 6-September-2024

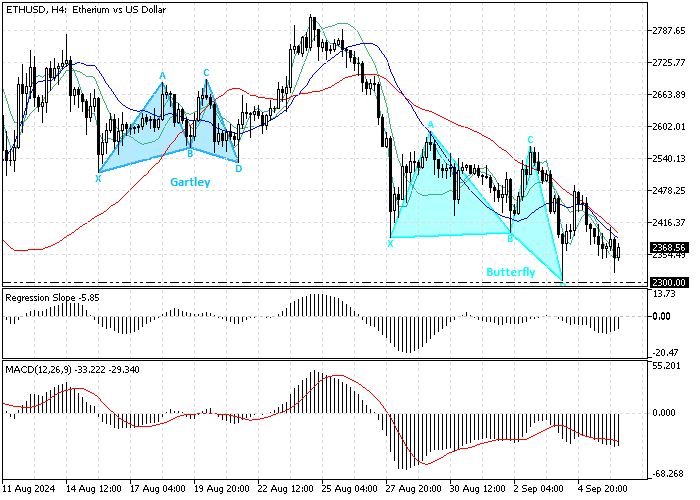
The first signal we notice when zoomed in on the 4-hour chart is that the Ethereum price is below the 50- and 100-period simple moving averages. This development in the dollar price against Ethereum signifies that the primary trend is bearish.
- The stochastic and RSI 14 indicators do not provide any significant signals; instead, they show a sideways market lacking momentum.
- On the other hand, the awesome oscillator signals divergence in its histogram while the bars are red and below the signal line. This is interpreted as the existing selling pressure, but the Ethereum price might consolidate near the upper resistance levels.

As for the harmonic pattern, the 4-hour chart formed a butterfly pattern with $2,300 as the critical resistance level. The MACD indicator is in line with the AO, signaling divergence.

Regarding the candlestick pattern, two bullish hammer candlestick patterns are spotted in the 4-hour chart, signaling a reverse trend or an imminent consolidation phase.
Overall, the technical indicators, harmonic pattern, and candlesticks suggest the primary trend is bearish, but Ethereum might erase some of its recent losses against the U.S. Dollar.
Ethereum Price Forecast – 6-September-2024

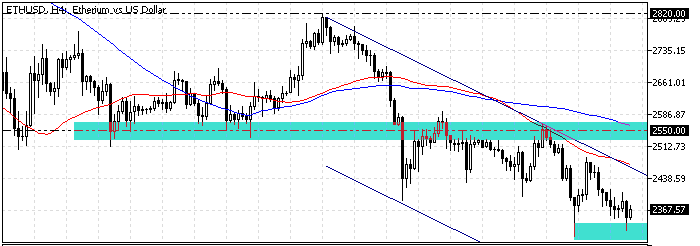
A consolidation phase could be imminent near the April 3 high ($2,550). Hence, monitoring the $2,550 mark for bearish signals, such as overbought stochastic, RSI, or bearish candlestick patterns, is essential.
From a technical standpoint, the downtrend will likely resume if the $2,550 resistance holds. This scenario’s primary target will be the August 5 low at $2,110.
ETHUSD Bullish Scenario – 6-September-2024

The $2,550 mark is the primary resistance to the current bear market. If the bulls (buyers) cross and stabilize the price above it, the consolidation phase from $2,110 will likely extend to the August 24 high at $2,820.
Furthermore, the bear market should be invalidated if the ETH/USD price exceeds $2,820. In this case, Ethereum’s path to the July 25 low ($3,805) will likely be paved.
Ethereum Support and Resistance Levels – 6-September-2024
Traders and investors should closely monitor the key levels below to make informed decisions and adjust their strategies accordingly as market conditions shift.
- Support: $2,110
- Resistance: $2,550 / $2,820 / $3,085
Disclaimer: This technical analysis is for informational purposes only. Past performance is not necessarily indicative of future results. Foreign exchange trading carries significant risks and may not be suitable for all investors. Always conduct your research before making any investment decisions.