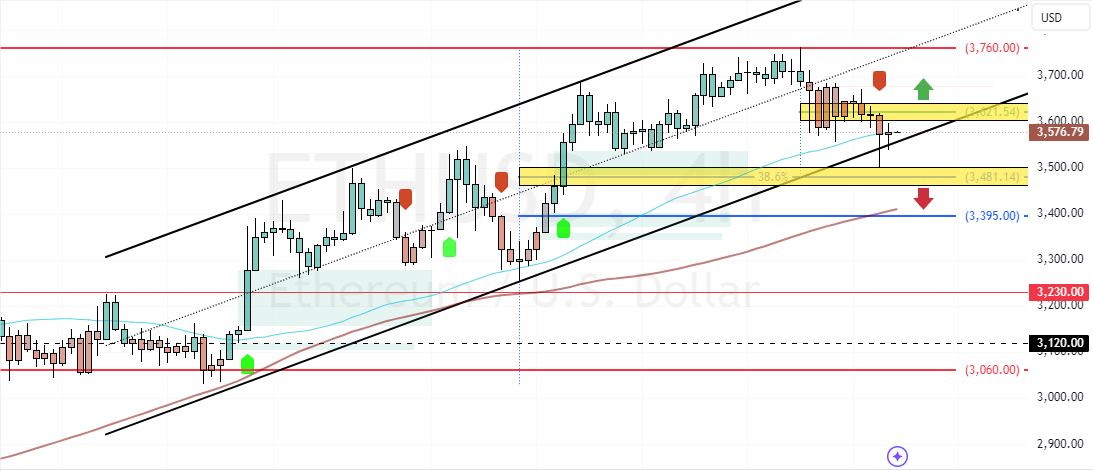
FxNews—Ethereum prices dipped from $3,760 as the Stochastic Oscillator hinted at an overbought market then. However, the downtrend eased near the 38.2% Fibonacci retracement level at $3,480, neighboring the 50-period simple moving average.
As of this writing, ETH/USD trades at approximately $3,545, bouncing off the Fibonacci support level.

Ethereum Technical Analysis
As for the technical indicators, the Stochastic Oscillator and RSI declined, depicting 30 and 43 in the description. Meanwhile, the Awesome Oscillator histogram is red, below zero, signaling a bear market.
Despite the bearish signals given by the momentum indicators, the cryptocurrency is yet above the 100-period simple moving average, making the primary trend bullish.
Overall, the technical indicators suggest that while the primary trend is bullish, the current bearish momentum could extend to lower support levels.
Ethereum Tested $3500 Resistance: What’s Next?

The immediate resistance is at $3,620. From a technical perspective, the uptrend will likely resume if bulls close and stabilize above this mark. In this scenario, the next bullish target could be retesting the November high at $3,760.
The Bearish Scenario
Conversely, the immediate support is $3,480. If Ethereum dips below this support, the current selling pressure could result in the prices testing the 100-period simple moving average at $3,395.