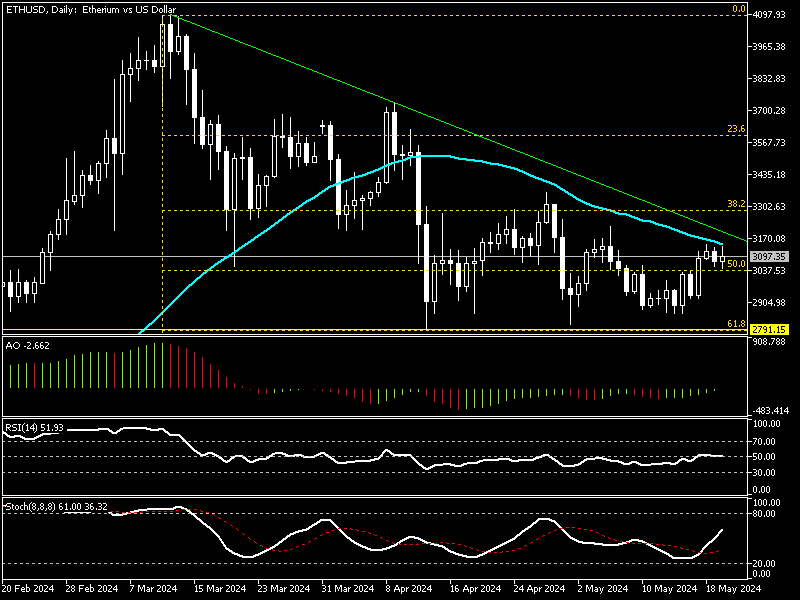
FxNews—Ethereum price pulled back from 61.8% Fibonacci retracement at $2,791. As of writing, the ETH/USD pair trades at about $3,105, a level that neighbors EMA 50 and the descending channel. The ETH/USD Daily chart below shows the current price movement, placement of EMA 50, and the descending trendline.
Ethereum Technical Analysis – Daily Chart

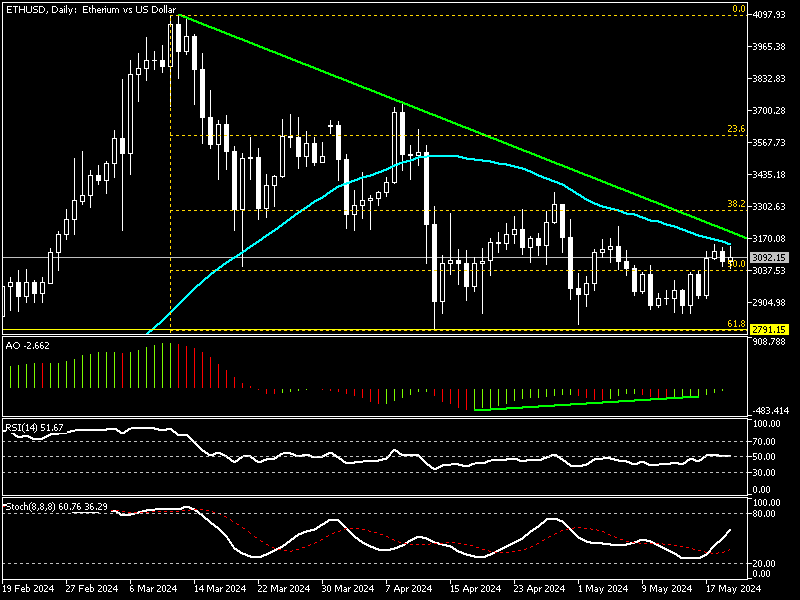
Ethereum Technical Analysis – Daily Chart
The primary trend is bearish because the market is below EMA 50 and the descending trendline. Despite the primary trend, Ethereum is moving sideways, as we can see from the price movements in the Daily Chart.

The awesome oscillator divergence signal promised the sideway momentum. As of today’s trading session, the indicator is about to hop above the zero line, suggesting bullish momentum.
The RSI value is 51, clinging to the median line, signaling an unbiased market. Concurrently, the stochastic oscillator %K value is increasing, recording 61.
These developments in the technical indicators in the ETH/USD Daily Chart suggest a cautious approach because the price is still below EMA 50, but the technical indicators signal bullish. It is worth noting that Ethereum’s primary trend will remain bearish as long as the asset trades below EMA 50.
We zoom into the ETH/USD 4-hour chart to conduct a detailed analysis and find key levels and trading opportunities.
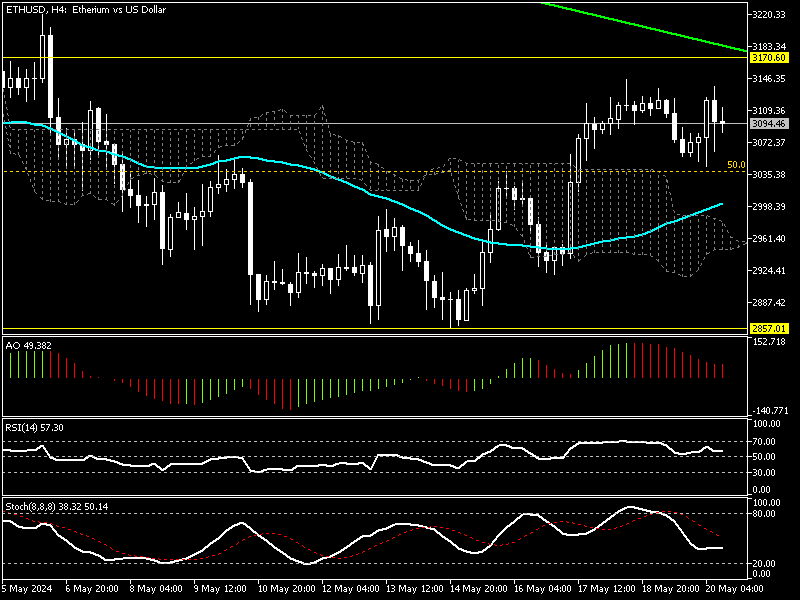
Ethereum Technical Analysis 4-Hour Chart

The 4-Hour Chart provides interesting information. The awesome oscillator value is 50, declining with red bars and approaching the zero line. The relative strength index and stochastic align with the awesome oscillator, with both indicators’ values decreasing. RSI record shows 57, and the Stochastic %K line value is 38.
On the other hand, the ETH/USD price crossed above the Ichimoku cloud and EMA 50, signaling a bullish trend.
Ethereum Value at Risk as Bears Dominate

From a technical standpoint, Ethereum is in a bear market regardless of the Ichimoku Cloud and EMA 50 signal in the 4-Hour Chart. This is because the price is below the descending trendline, depicted in green in the 4-hour chart above.
If the bears maintain the Ethereum value below the descending line at about $3,170, the selling pressure will likely increase. In this scenario, the immediate target could be $2,857, followed by April’s low at $2,791. If the pressure persists, the Ethereum price could dip deeper.
The Bullish Scenario
The $3,170 immediate resistance plays the role between the bear and the bull market. If the bulls can manage to close and stabilize the Ethereum price above the $3,170 mark, the uptick momentum began from April’s low will likely target the 38.2% Fibonacci ($3,286) followed by 23.6% at $3,594.