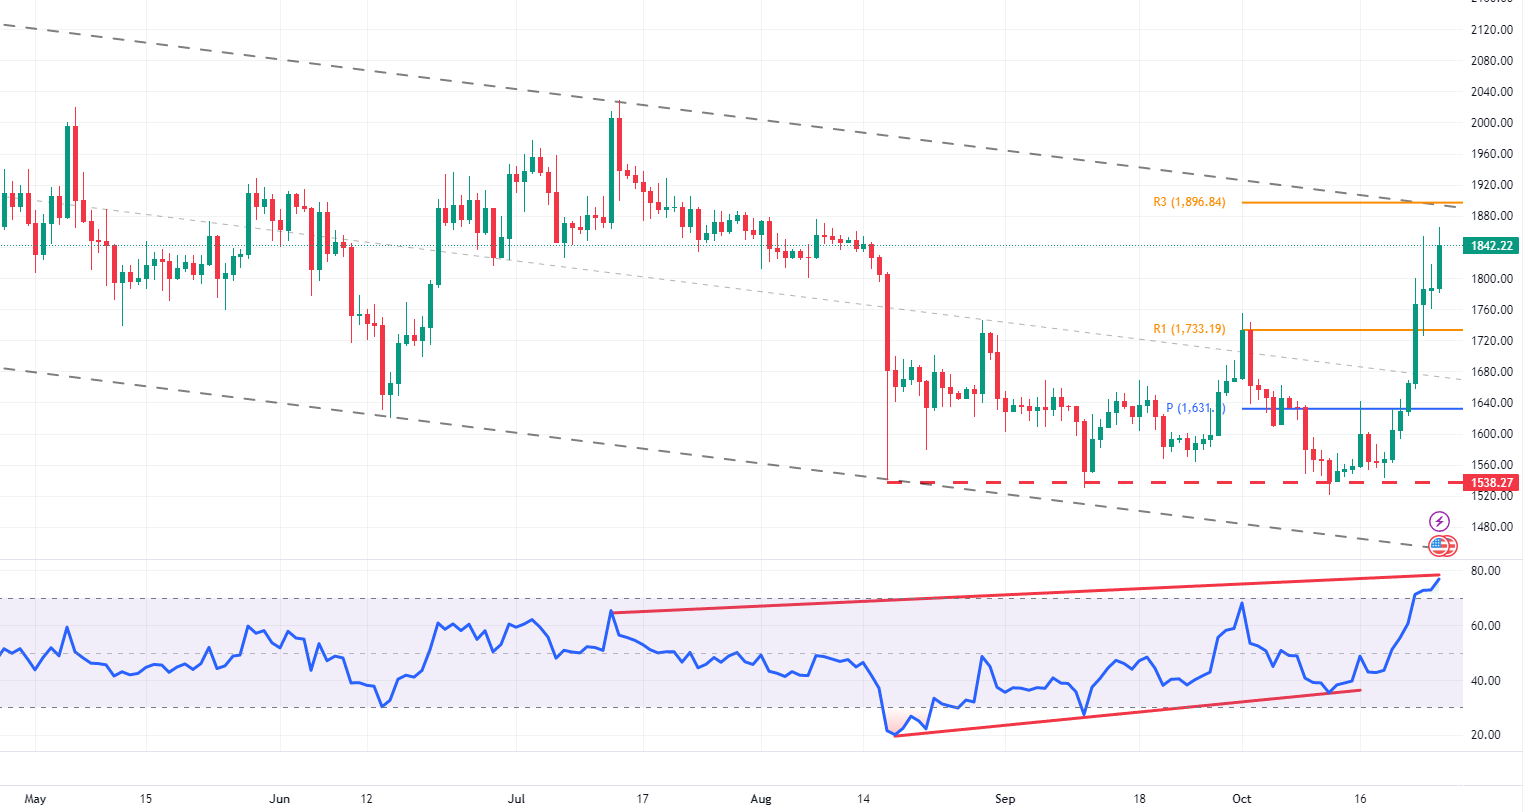
The RSI divergence has again proven its reliability, correctly signaling a rise in the Ethereum price. Currently, Ethereum is trading near the upper line of the bearish channel and R3 resistance, which stands at $1,896. In the daily chart of ETHUSD, we can observe a bearish RSI divergence. The indicator hovers in the overbought area, potentially indicating a price reversal or a correction phase for Ethereum.
ETHUSD Technical Analysis – RSI Divergence is Bearish

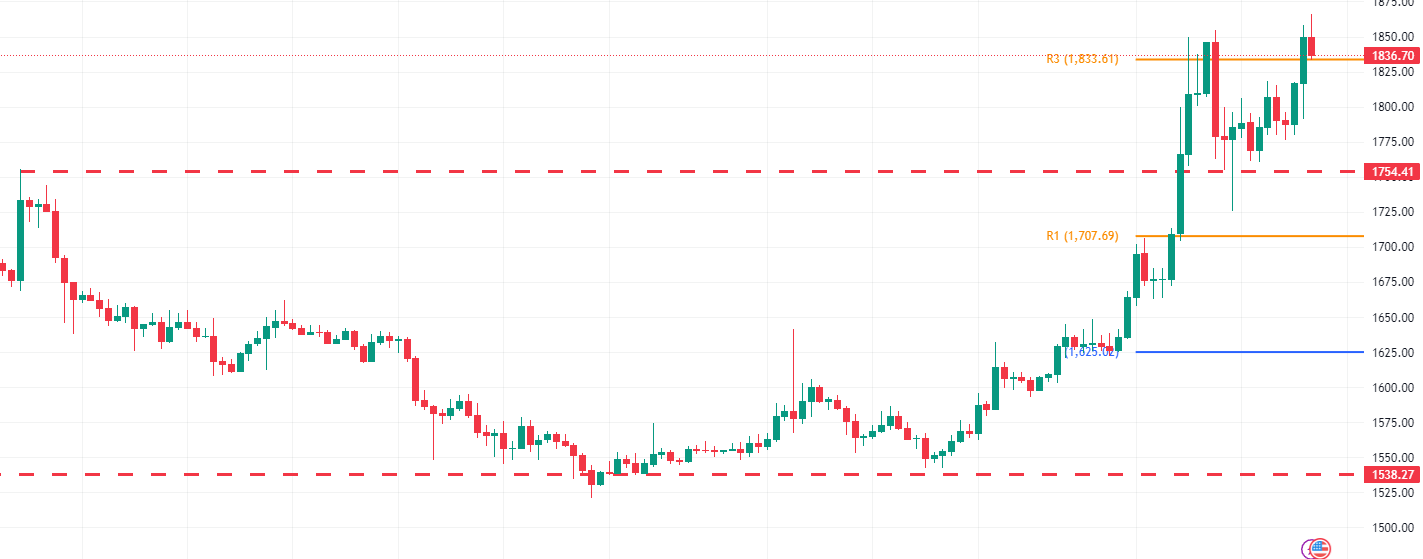
For a more detailed insight into the ETHUSD pair, let’s zoom into the 4-hour chart. The key support bolstering the bullish bias is at $1,754. We recommend waiting for the price to react to the daily R3 and the overbought RSI before initiating any new trades.

The $1,754 level offers an attractive entry point for bullish traders looking to re-enter the market at a lower price. However, if this level breaks, we could see an extended decline in the ETHUSD price down to the pivot.