In today’s comprehensive EURCAD forecast, we will first scrutinize the current economic conditions in Canada. Following that, we will meticulously delve into the details of the technical analysis of the EURCAD pair.
Steady Start for Canadian Stocks
Bloomberg—The S&P/TSX Composite index, a key indicator of the Canadian stock market, started the week with little change, hovering around the 19,650 mark. This comes after a slight pullback last week as investors continue to evaluate the effects of rising interest rates on corporate performance.
Major companies showed modest fluctuations in the financial sector, with some even recording gains. This is largely due to the stabilization of government bonds, which have remained below their early October peaks. The prospect of improved lending conditions has bolstered the credit health outlook and reduced the risk of loan defaults for major Canadian banks. Royal Bank of Canada (RBC) and Toronto-Dominion Bank (TD Bank), the two largest companies in the TSX blue-chip index, stayed in positive territory.
The mining sector, on the other hand, showed mixed results due to ongoing volatility in gold and base metal prices. Agnico Eagle, a leading gold miner, saw its shares drop by 0.5%, while Barrick Gold, another major player in the industry, recorded slight gains.
These market trends have significant implications for the Canadian economy. On the one hand, the stability in the financial sector and the resilience of major banks could be seen as positive signs, suggesting a robust economic environment. On the other hand, the volatility in the mining sector could indicate potential risks and uncertainties. Overall, these developments provide valuable insights into the health and direction of the Canadian economy.
EURCAD Technical Analysis and Forecast

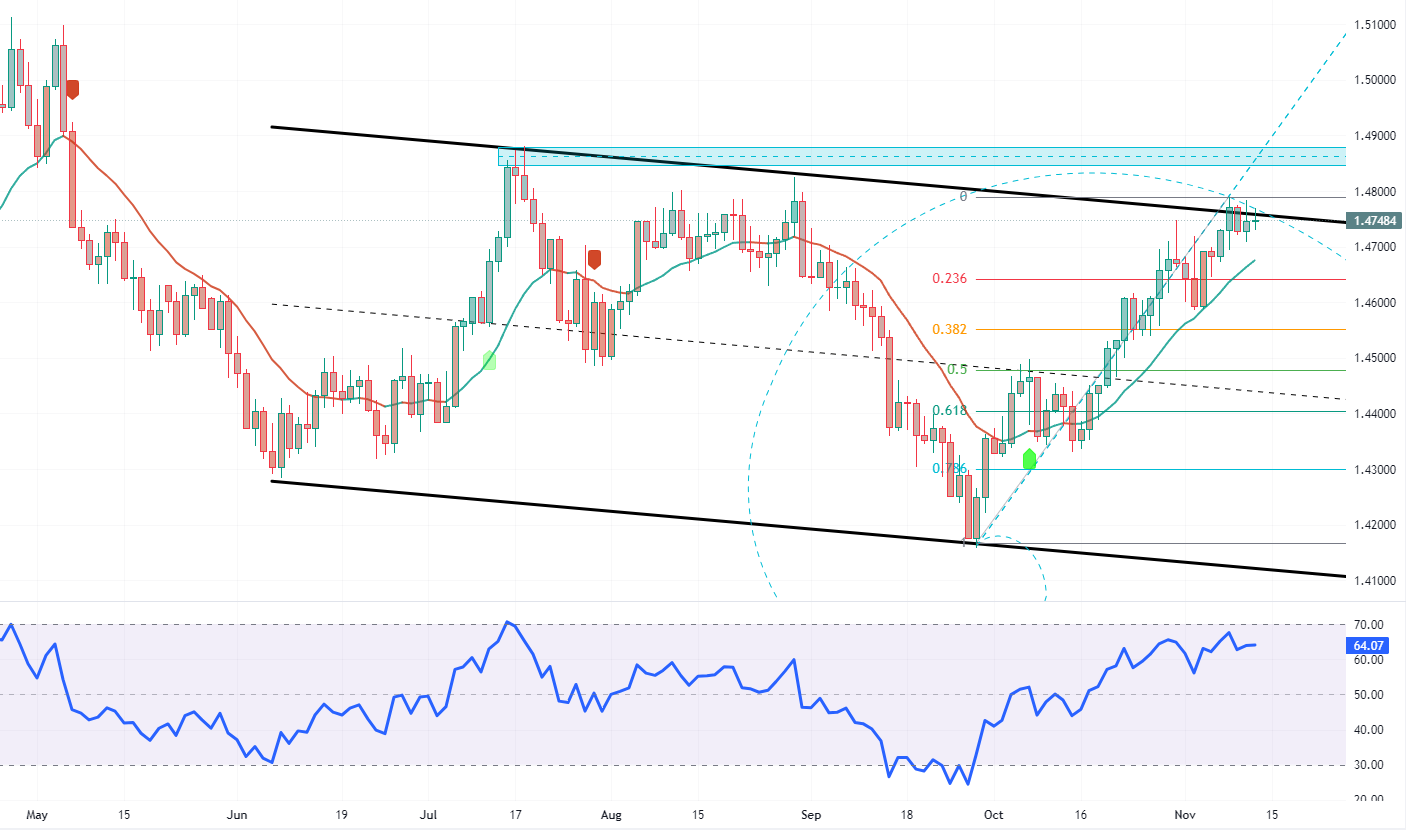
Currently, the EURCAD is trading close to the upper line of the bearish flag, around 1.4750. On the daily chart, the RSI indicator is approaching 70, indicating strong momentum. The market trend remains bullish despite the absence of bearish candlestick patterns in the daily chart. Consequently, the EURCAD could extend its gains to the July high, around the 1.49 ceiling.
The 23.6% Fibonacci retracement level supports this bullish scenario. However, analysts at FxNews advise caution. We recommend waiting for a clear breakout above the 1.49 resistance before entering a bullish trade.

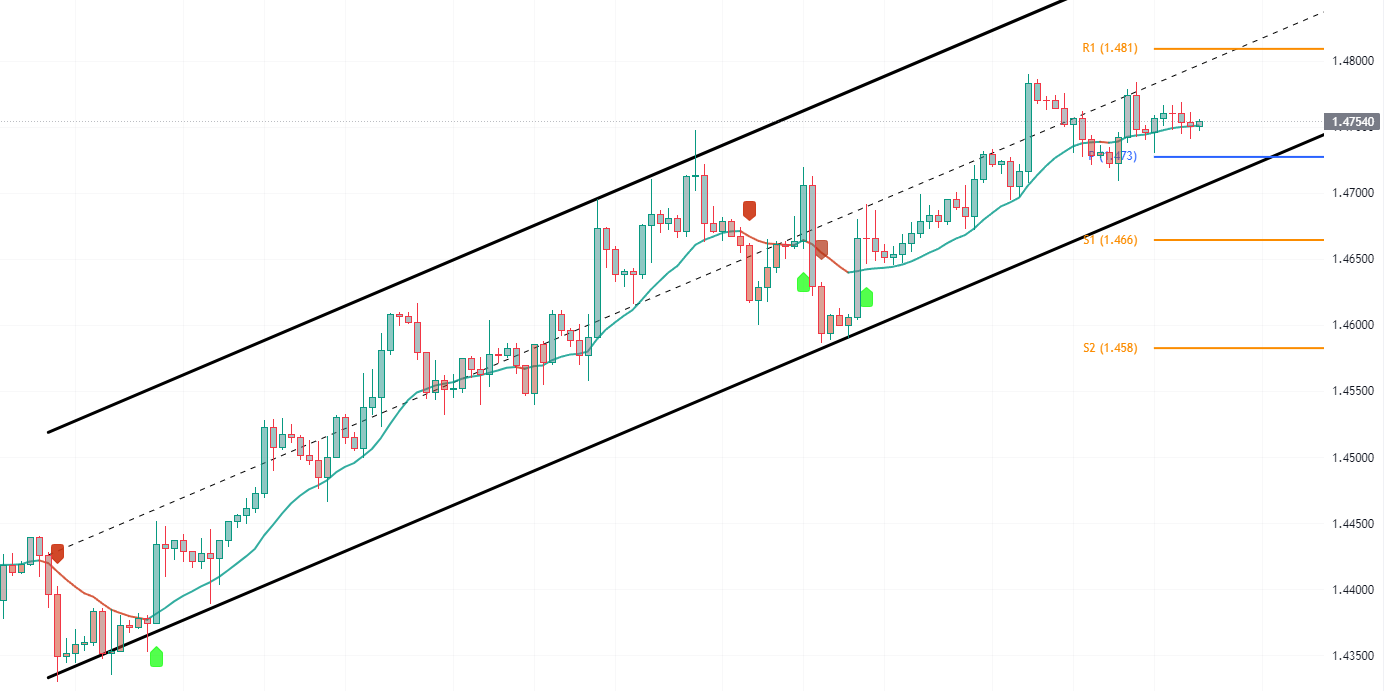
From a bearish perspective, it’s helpful to examine the 4-hour chart, especially since the pair is trading near a key resistance level. To consider a sell order, it would be prudent to wait for the EURCAD to break below the bullish flag or stabilize below the 1.473 pivot point. If this occurs, the pair could decline to the S1 support level, followed by further decreases.