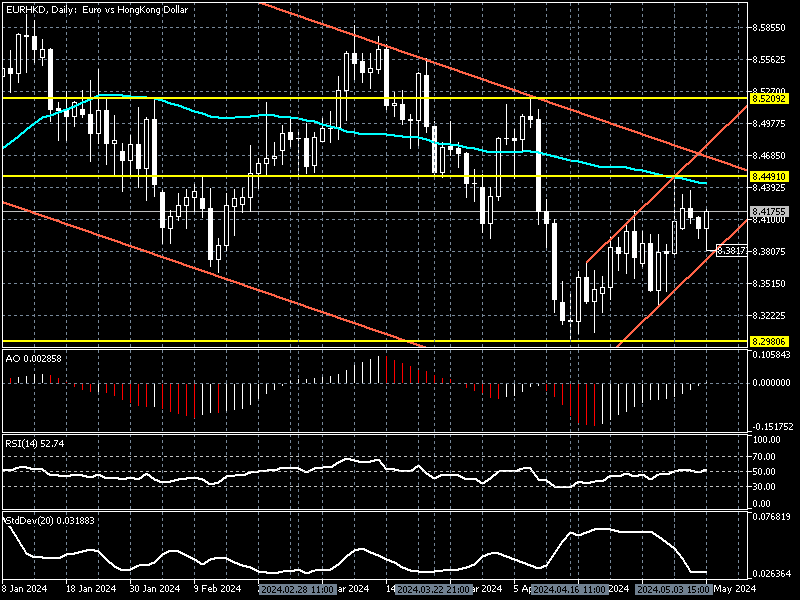
FxNews–The European currency ranges below the 8.44 resistance against the Hong Kong dollar. The EURHKD exchange rate dipped to 8.38 in today’s trading session. The daily chart below shows that the primary trend is bearish, but the Euro has been in a short-term uptrend since April 16.

We zoom into the 4-hour chart to find key support and resistance levels and seize potential trading opportunities.
EURHKD Bounces Off EMA 50

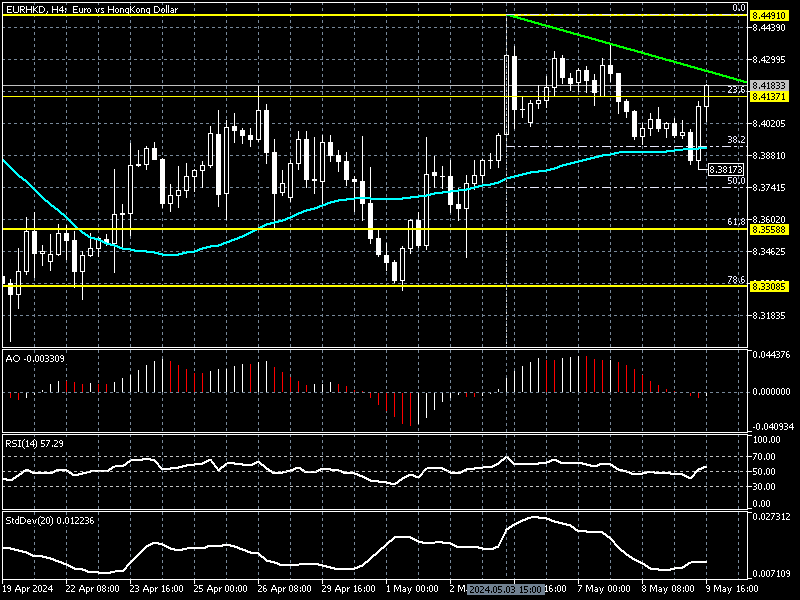
As of writing, the price has bounced from EMA 50. This minor resistance at the 8.381 mark has the %38.2 Fibonacci retracement level as the backup. Interestingly, the pullback from 8.381 formed a long-body bullish candlestick, which can be interpreted as the uptrend momentum hasn’t been weakened yet.
The technical indicators don’t provide any significant signal. The awesome oscillator bars are small and clung to the zero line, while the RSI has been moving sideways around the 50 levels. It is worth noting that the standard deviation’s value is low at 0.012, indicating the pair lacks momentum.
EURHKD Forecast – Bulls Poised for 8.44 Resistance

From a technical perspective, if the Euro maintains its position above EMA 50 (the 8.381 mark), the bullish wave that began on April 16 from 8.298 will likely retest May’s all-time high, the 8.449 resistance, a significant barrier that could halt the short-term bullish trend.
It is worth noting that the market has reacted to the 8.449 pricing area seven times since October 23, proving its robustness. Therefore, forex traders and investors should monitor the 8.449 mark closely because if it reaches it, the market will likely turn bearish.
The Bearish Scenario

On the flip side, if the EURHKD exchange rate falls below EMA 50 or the 8.381 mark, the downtrend that began on May 3rd from 8.449 will likely extend to 61.8% (8.355) Fibonacci, followed by 78.6, the 8.330 mark.
EURNOK Key Support and Resistance
- Resistance: 8.449
- Pivot: 8.413
- Support: 8.381, 8.355, 8.330