...

EURJPY Analysis – Potential Breakout

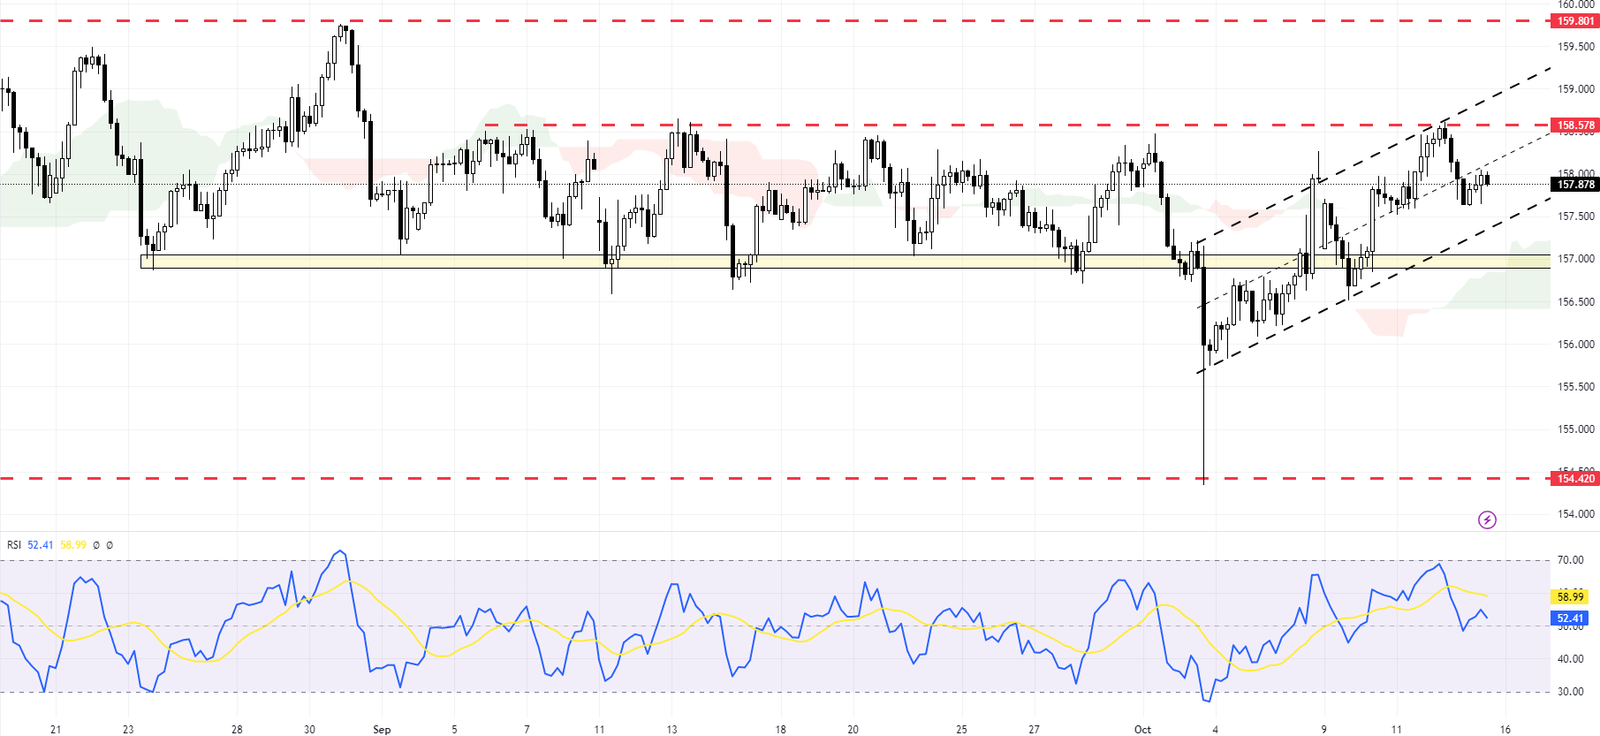
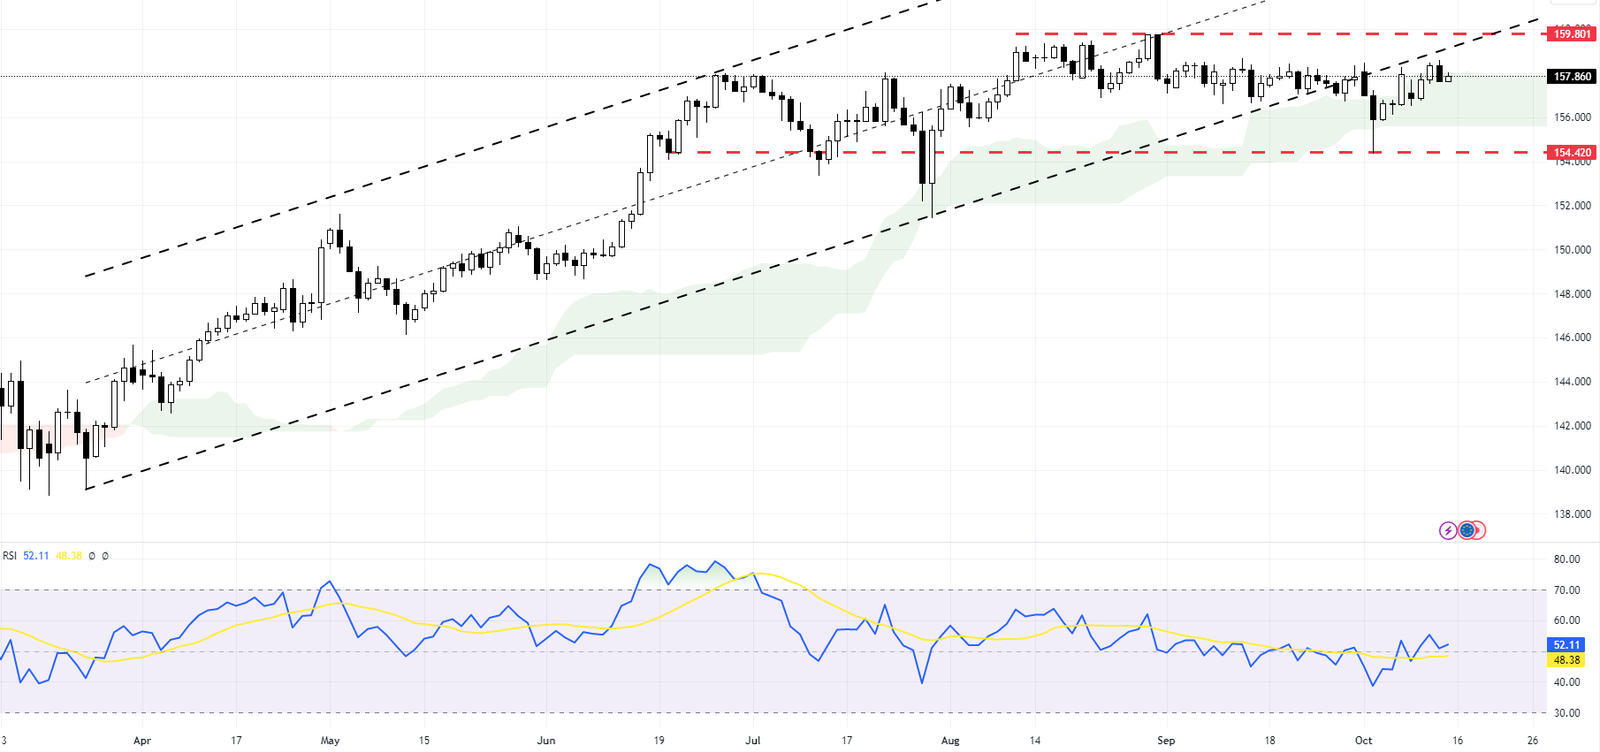
Our latest EURJPY forecast shows that the EURJPY currency pair has been trading between 154 and 159 since early August. This range-bound movement is common in forex trading when the forces of supply and demand are closely matched.
EURJPY Analysis - Potential Breakout
EURJPY Analysis – Potential Breakout

EURJPY Analysis – Potential Breakout

FxNews – The EURJPY pair maintains a bullish bias, trading above the Ichimoku cloud. The Ichimoku cloud is a popular technical analysis tool that defines support and resistance, identifies trend direction, gauges momentum, and provides trading signals. Interestingly, the pair failed to close below the cloud, indicating that the bulls were in control. They’ve pushed the price back above the Ichimoku cloud, and now, EURJPY is testing the previously broken support.

The main resistance for this currency pair lies at the 158.57 threshold in the 4H chart. With the Relative Strength Index (RSI) hovering above 50, we anticipate this level will likely be breached in upcoming sessions. The RSI is a momentum oscillator that measures the speed and change of price movements. Traditionally, readings over 70 are considered overbought, and readings under 30 are considered oversold. However, a reading above 50 in trending markets can indicate that the uptrend is in good health and likely to continue.
EURJPY Analysis - Potential Breakout
EURJPY Analysis – Potential Breakout

On the other hand, support for EURJPY is at 154.42. The bears must push and close below this level to take control of the market and end the bullish sentiment.

In conclusion, our EURJPY Analysis suggests a potential continuation of the bullish trend unless key support levels are broken.

Latest Posts

Gold Dipped Below $2667 Awaiting Direction

Gold traded sideways after it dipped below $2,667 and...

Gas Prices Dip Under $1.99 Amid Bearish Signs

Gasoline prices dropped below $1.99, which is active resistance....

Natural Gas Rebound Targets $3.24 and Beyond

U.S. natural gas bounced from $3.1, hinted by Stochastic's...

Crude Oil Head and Shoulders Signals Downward Trend

Crude oil formed a head and shoulders pattern in...

Inverted Hammer Hints at USDJPY Consolidation Ahead

USD/JPY trades bullish amid overbought signals. The 4-hour chart...

Gold Dipped Below $2667 Awaiting Direction

Gold traded sideways after it dipped below $2,667 and...

Gas Prices Dip Under $1.99 Amid Bearish Signs

Gasoline prices dropped below $1.99, which is active resistance....

Natural Gas Rebound Targets $3.24 and Beyond

U.S. natural gas bounced from $3.1, hinted by Stochastic's...

Crude Oil Head and Shoulders Signals Downward Trend

Crude oil formed a head and shoulders pattern in...

WTI Falls Below $71.5 on New Sanctions Against Russia

WTI Crude Oil prices fell slightly below $71.5 a...

Watch for Potential Drop in Gasoline Prices Below $2

FxNews—Gasoline is bullish. However, a dip below $1.99 could...

NATGAS Tests Critical Resistance: Bears Target $3.21

FxNews—The U.S. Natural Gas trades bullish above the %50.0...

Bullish Crude Oil Signals Overbought at $70.5

FxNews—Crude Oil trades bullish, above the 75-period simple moving...