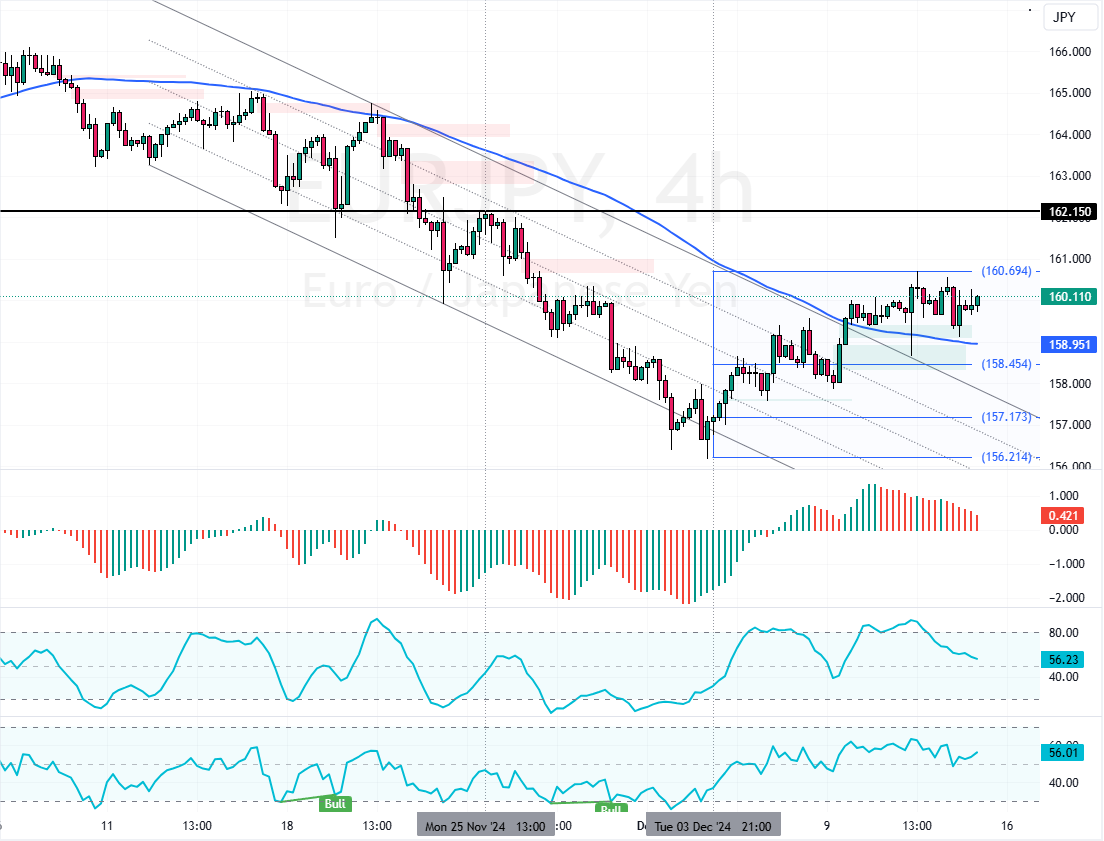
FxNews—EUR/JPY shifted above the 75-period SMA, trading at approximately 160.0. The technical indicators hint at a bearish trend should prevail. A dip below 158.9 could trigger a new move to 157.6.

EURJPY Technical Analysis – 13-December-2024
The currency pair shifted above the 75-period simple moving average earlier this week. However, the uptick eased near the 160.9 critical resistance level. As of this writing, EUR/JPY trades sideways at approximately 160.0, gaining 0.2% today.

As for the technical indicators, the Awesome Oscillator value is dropping, and the bars are red, approaching the signal line from above. This suggests the bullish sentiment in the market has weakened.
Additionally, RSI 14 and Stochastic hover in the middle, recording 55 in the description, hinting at an uncertain trend.
Overall, the technical indicators suggest that EUR/JPY lacks momentum and is awaiting a bearish or bullish breakout.
EURJPY Risks Fall to 157.6 Below The 158.4 Resistance
The immediate resistance is at 158.4, backed by the bullish fair value gap and the 75-period SMA. From a technical perspective, the downtrend will likely resume if EUR/JPY breaks below this supply zone. In this scenario, the next bullish target could be the 78.6% Fibonacci at 157.1.
Furthermore, if the selling pressure pushes the price below 157.1, the sellers’ path to the December 3 low at 156.2 could be paved.
Bullish Scenario
Please note that the bearish outlook should be invalidated if EUR/JPY exceeds the immediate resistance, the 160.6 mark.
If this scenario unfolds, the bullish wave will likely resume, targeting the November 25 high at 162.1.