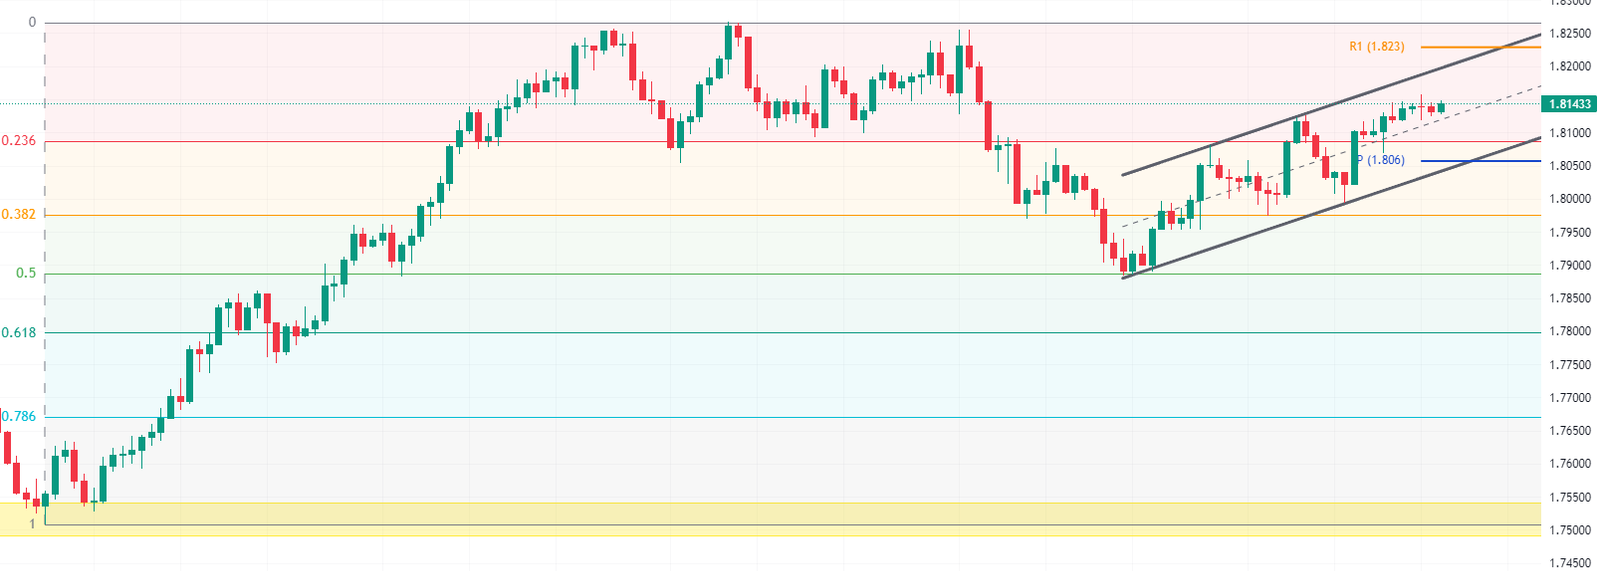
In today’s comprehensive EURNZD forecast, we will first examine New Zealand’s current economic conditions. Then, we will meticulously examine the technical analysis of the EURPLN pair.
New Zealand Bond Yield Rising
In a recent development, the yield on New Zealand’s 10-year government bond increased, reaching 5.225% on Monday. This rise came after a dip to 5.174% in the previous session. The upward trend in New Zealand bond yield reflects a similar pattern observed in its US counterpart. This was triggered by Moody’s decision to downgrade the US credit outlook due to escalating fiscal deficits and ongoing political deadlock.
The Role of the Reserve Bank of New Zealand
Bloomberg—Market speculations suggest that the Reserve Bank of New Zealand (RBNZ), known for its hawkish stance, will persist in its efforts to curb persistent inflation. This speculation is based on the anticipation of the final policy meeting of the year scheduled for November 29th. In their early October meeting, the board maintained the borrowing costs at 5.5% for the third consecutive time. However, they cautioned that restrictive borrowing costs would need to be sustained longer to achieve the targeted inflation range of 1 to 3% annually.
Meanwhile, the latest PMI figures indicate a contraction in New Zealand’s service activity for the fifth time this year in October. Significant economic data from China, a key trading partner, is expected this week. This includes figures on industrial output, retail turnover, and surveyed unemployment.
The rise in the bond yield could have various implications for New Zealand’s economy. On one hand, it could indicate an expectation of higher inflation or economic growth. On the other hand, it could also signal increased borrowing costs, potentially slowing down economic activity. Therefore, monitoring these developments closely is crucial to understanding their potential financial impact.
EURNZD Technical Analysis and Forecast
The EURNZD currency pair currently exhibits a bullish flag pattern, a technical chart formation that often signals a potential upward trend. As it tests the mid-line of the bullish channel, market watchers are predicting a likely surge in the EURNZD price.

The trend remains bullish, with the next target at the R1 resistance level (1.823). If reached, this price point could indicate strong upward momentum. Following this, the pair may test the high reached in October. The bulls could also shatter the October ceiling, further increasing the price.
The pivot supports this bullish scenario. The pivot is a technical analysis indicator used to determine the market’s overall trend over different time frames. However, if this level breaks, the EURNZD price could decline to the low of November. This coincides with the 50 Fibonacci retracement level, a popular technical tool traders use to predict potential support and resistance levels.
Stay tuned for more updates on the EURNZD forecast as we monitor these key levels and trends. We aim to provide accurate and timely information to help you make informed trading decisions.