In today’s comprehensive EURNZD forecast, we will first scrutinize New Zealand’s current economic conditions. Then, we will meticulously delve into the details of the EURNZD pair’s technical analysis. Stay tuned for insightful observations and key takeaways.
EURNZD Forecast – NZX50 and Bullish Trend Factors
Bloomberg – The New Zealand stock market saw a minor increase, with the NZX 50 index gaining 7.11 points, or just under 0.1%, to close at 11,221.48 on Wednesday. Despite ongoing concerns about the Chinese property market, this modest rise came as traders digested encouraging data from China, New Zealand’s key trading partner.

New Zealand reported a higher-than-expected annual growth rate of 4.9% in the third quarter, surpassing the forecasted 4.4%. September’s industrial output and retail trade figures also suggested an uptick in consumption and activity.
Despite a shaky start to the day, the NZX 50 recovered from its morning losses, hovering close to its lowest level in nearly a year. The index saw gains primarily in manufacturing and healthcare, while commercial services, consumer goods, and utilities struggled.
Looking ahead, traders are awaiting Thursday’s release of New Zealand’s export and import data for September. There are growing concerns that these figures could decline further due to subdued domestic and international demand.
On the company front, Scott Tech saw its shares rise by 4.2%, Seeka Ltd increased by 3.5%, while AFT Pharmaceuticals and Scales Corp saw gains of 2.9% and 1.6%, respectively.
EURNZD Forecast: The Bullish Outlook
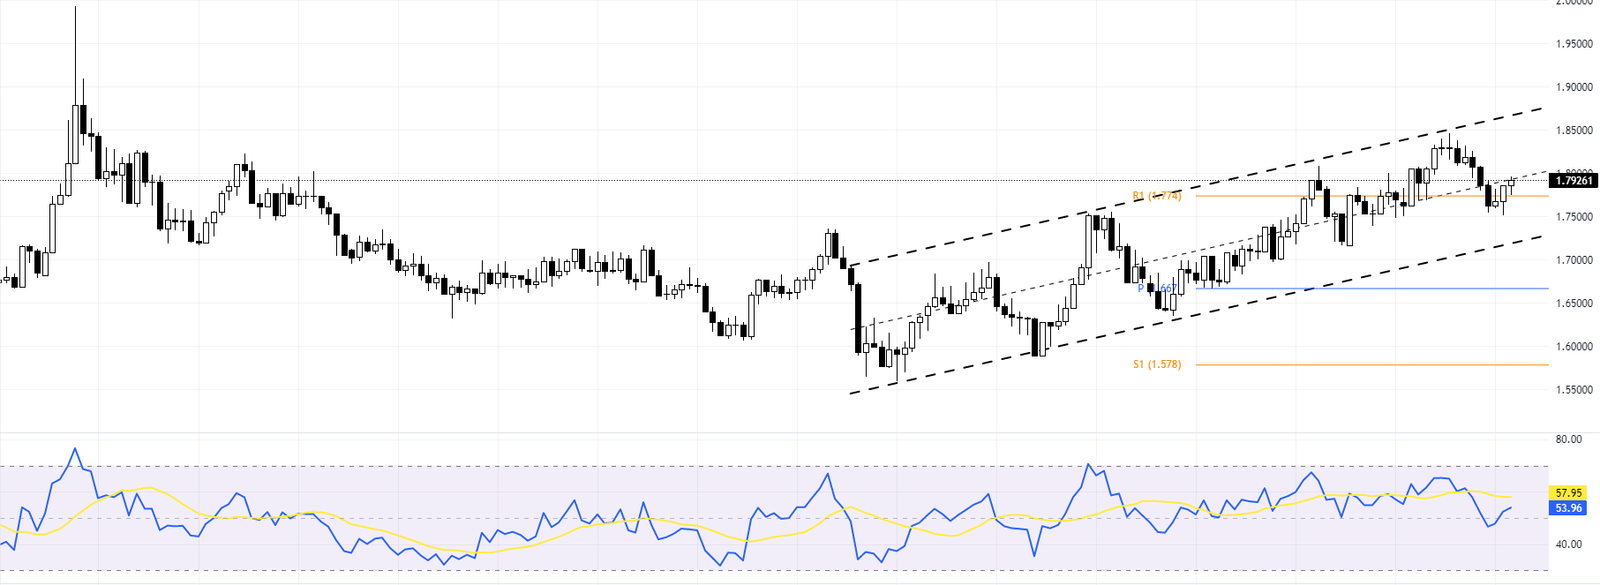
The EURNZD pair currently exhibits a bullish trend in the weekly chart, trading above the key support level of 1.774. This positive momentum is further confirmed by the RSI indicator flipping above the mid-line, signaling a bullish outlook for the EURNZD pair.

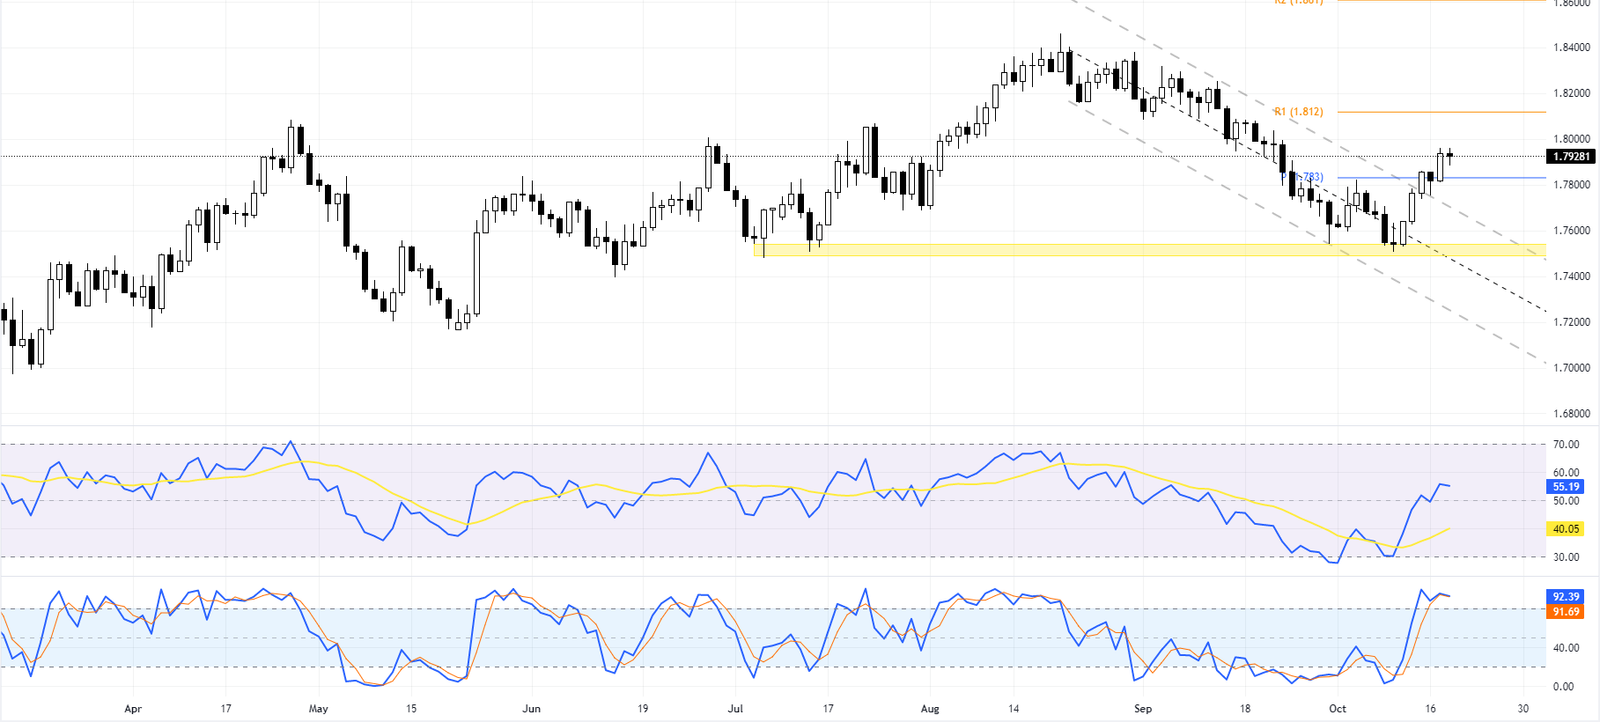
We delve into the daily chart to gain a more detailed perspective on the EURNZD forecast. Here, we observe that the pair has closed above 1.783, breaking out of the daily bearish channel. While the RSI indicator remains above the mid-line, suggesting bullish momentum, the stochastic oscillator indicates that the pair might be overbought. This suggests that despite the overall bullish outlook for the EURNZD forecast, there could be a potential correction to the recent gains, with a retest of the pivot point.

With the price currently above the pivot point, our EURNZD forecast anticipates that the pair will target the resistance level at 1.812, followed by an attempt to reach August’s high of around 1.816.
However, should the pair fall below 1.78, this would pause the bullish scenario and could lead to a retest of the previous supply area of around 1.75.
Key Levels to Watch
Key levels are crucial in the EURNZD forecast, providing significant insights into the currency pair’s potential price movements. These levels, which include support and resistance points, pivot points, and psychological levels, serve as markers for traders to understand market sentiment and make informed decisions.
- Pivot: 1.78
- Resistance: 1.81
- support 1.75
By identifying these key levels, traders can anticipate possible price reactions and adjust their strategies accordingly. Therefore, a comprehensive EURNZD forecast always thoroughly examines these key levels.