FxNews—In today’s comprehensive EURSGD forecast, we will scrutinize Singapore’s current economic conditions and meticulously delve into the details of the technical analysis of the EUR/SGD pair.
Singapore NODX Overview in October 2023
Bloomberg—In October 2023, Singapore witnessed a decline in its non-oil domestic exports (NODX), but the decrease was less severe than anticipated. The NODX fell by 3.4% compared to the same month last year, a noticeable improvement from the predicted 6.5% drop. This change marks a significant shift from the 13.2% fall recorded in September.
Interestingly, this is the 13th month in a row that Singapore’s NODX has contracted, yet this month shows the mildest decrease in this ongoing trend.
Key Sectors: Electronics and non-electronics
The decrease in NODX was influenced by both electronic and non-electronic products, albeit to different extents. Electronic product shipments declined by 5.6%, an improvement from the 11.6% drop in September. This reduction was mainly due to lower shipments in specific categories:
- Integrated Circuits (ICs) saw a 17.6% decrease.
- Diodes and transistors experienced a 19.8% fall.
- Computer parts shipments dropped by 22.9%.
On the other hand, non-electronic product shipments decreased by 2.7%, a substantial improvement from the 13.7% plunge in September. This decline was primarily driven by three product groups:
- Food preparations, which saw a 41.7% reduction.
- Non-electric engines and motors declined by 55.4%.
- Electrical machinery, with a 29.7% fall.
Trade Partners
Singapore’s trade dynamics showed mixed results across different regions. Sales to countries like Taiwan, South Korea, the United States, and Indonesia decreased significantly, ranging from 10.5% to 43.7%. However, this was contrasted by increased trade with China and the European Union, where sales grew by 38.5% and 5.9%, respectively.
Interestingly, when adjusted for seasonal variations, Singapore’s NODX grew 3.4% in October 2023. This is a positive turn, especially compared to the 11.1% increase in September, which is higher than the expected 1.5% growth.
Impact on the Economy
The fluctuating trends in Singapore’s NODX indicate broader economic shifts. While the consistent contraction over 13 months might raise concerns, the slower rate of decline and the positive growth in specific sectors and regions are encouraging signs. This suggests resilience in particular industries and adaptability in trade relationships.
The overall impact on the economy is nuanced. While the contractions could indicate global trade or production challenges, the recent improvements and growth in key areas highlight the potential for recovery and stability in Singapore’s export sector.
EURSGD Forecast: Technical Analysis
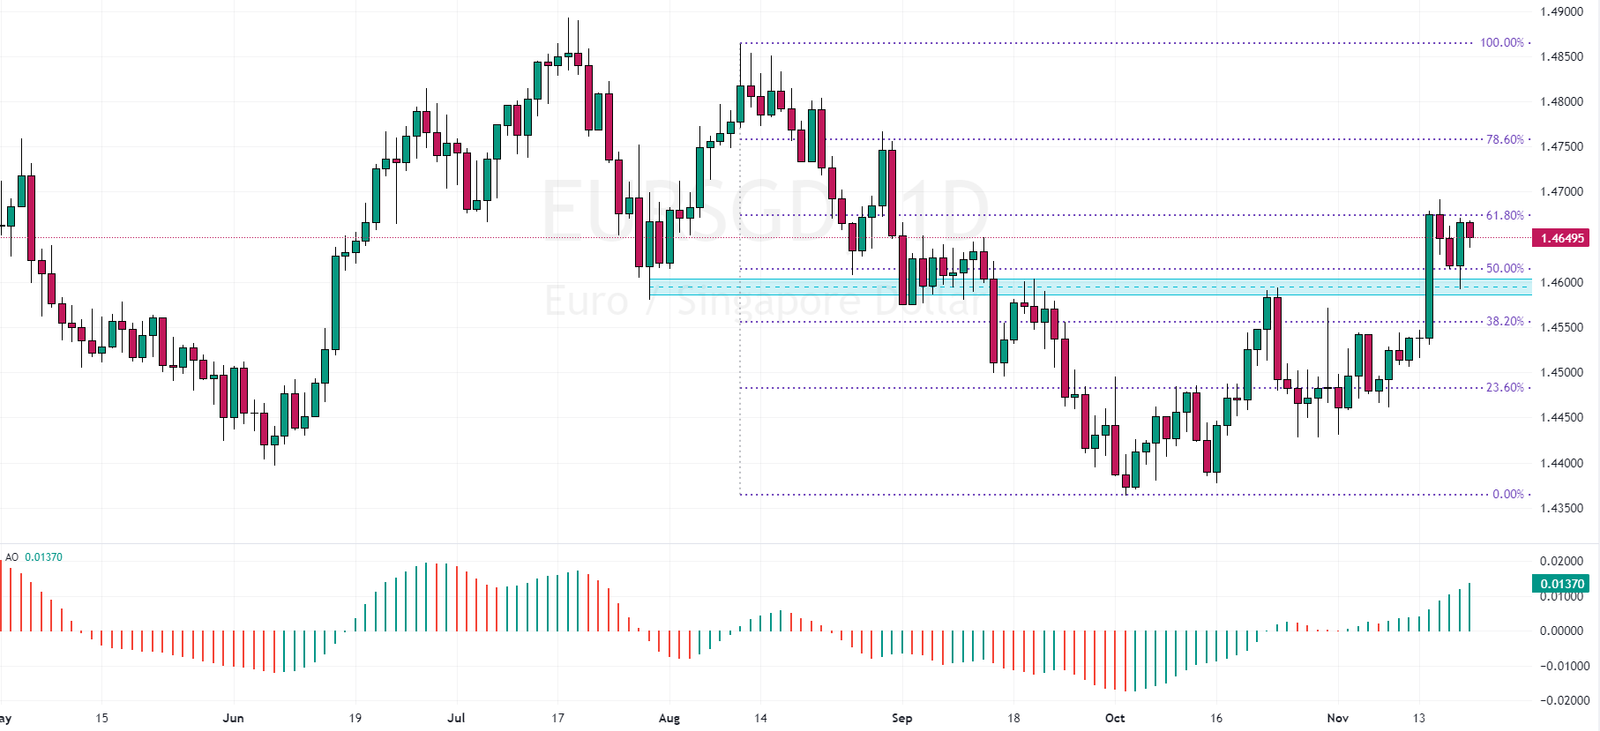
The EURSGD uptrend recently showed signs of easing at the 61.8% Fibonacci level. Last Friday, the pair tested the 50% level but rebounded within the same trading session, indicating a strengthening bullish market. However, a divergence signaled by the awesome oscillator suggests potential market ranging or a trend reversal.

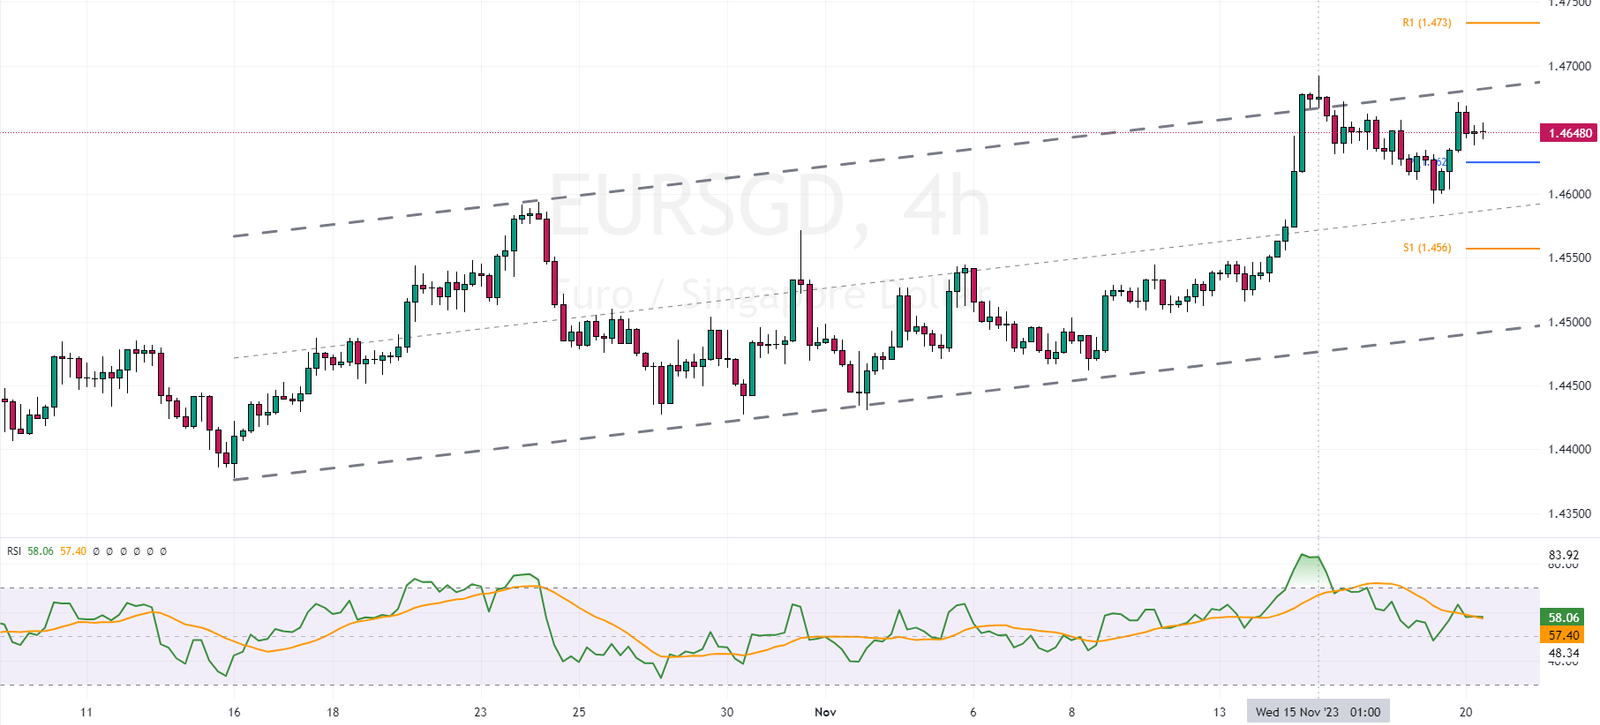
A closer look at the 4-hour chart is essential to gain a deeper insight into the EURSGD price action and market behavior. EURSGD trades within a bullish flag pattern in this timeframe and remains above the pivot point. The currency pair has repeatedly tested and bounced off the upper line of the flag. Concurrently, the RSI indicator was hovering in the overbought zone, adding another layer of complexity to the analysis.

Given the awesome oscillator divergence observed on the daily chart, analysts at FxNews recommend monitoring the weekly pivot, currently positioned at 1.46. A close below this level could signify an extension of the short bias that began on November 15th, potentially leading to a decline toward the S1 support level and subsequently to the lower boundary of the bearish flag.
This bearish scenario gains credence from the November high of 1.47. Until this level is breached, the bullish trend may be considered paused rather than reversed.