Today, we delve into an in-depth EURUSD Bollinger Bands Analysis and explain the recent updates on the Zew index to help you better understand the market trends.
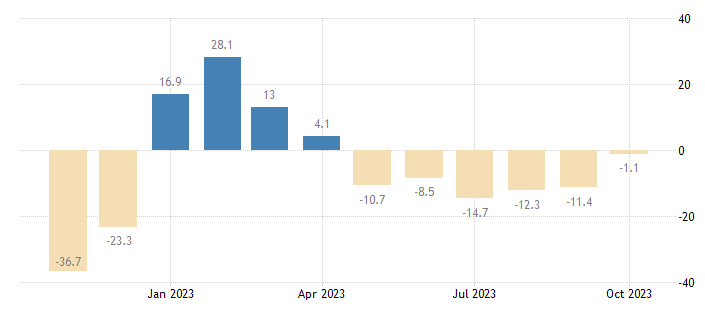
Germany’s ZEW Economic Sentiment Indicator jumped 10.3 points to -1.1 in October 2023, surpassing market forecasts of -9.3. This is the highest level since April, suggesting that Germany, the biggest European economy, is bouncing back.

This optimism is fueled by hopes of lower inflation and stable short-term interest rates in the Eurozone, as predicted by over 75% of respondents. Despite the Israel conflict, the overall outlook has improved. The economic situation in Germany shows signs of steadying, with its indicator slightly dropping 0.5 points to -79.9, the lowest since August 2020.
EURUSD Bollinger Bands Analysis
The EURUSD pair is currently demonstrating a bearish trend. This trend is evident in the trading channel, which has consistently leaned towards the downside. Today, we observed a significant event – the pair closed below the 1.0548 pivot point. This pivot point is noteworthy as it aligns with the middle line of the Bollinger Bands, a popular tool traders use worldwide for market analysis.

The Relative Strength Index (RSI), another crucial indicator in technical analysis, is currently hovering below the 50 line. This suggests that the market is potentially bearish, and it’s common to see further declines in such scenarios. Our EURUSD Bollinger bands analysis indicates it could target lower levels at 1.046, followed by 1.04.
However, every EURUSD Bollinger Bands analysis should consider both sides. On the flip side of our bearish outlook, key resistance levels could halt this downward trend. The upper line of the bearish channel and the 1.06 level serve as strong resistance in our EURUSD Bollinger Bands analysis.
If the price of the EURUSD pair manages to close above this resistance level, it could potentially disrupt the bearish outlook. Such a scenario would warrant a reassessment of the market conditions and adjustment of trading strategies.
In conclusion, while our current EURUSD Bollinger Bands analysis points towards continuing the bearish trend for EURUSD, market conditions are dynamic and subject to change. Therefore, traders must stay updated with market movements and adjust their strategies accordingly.