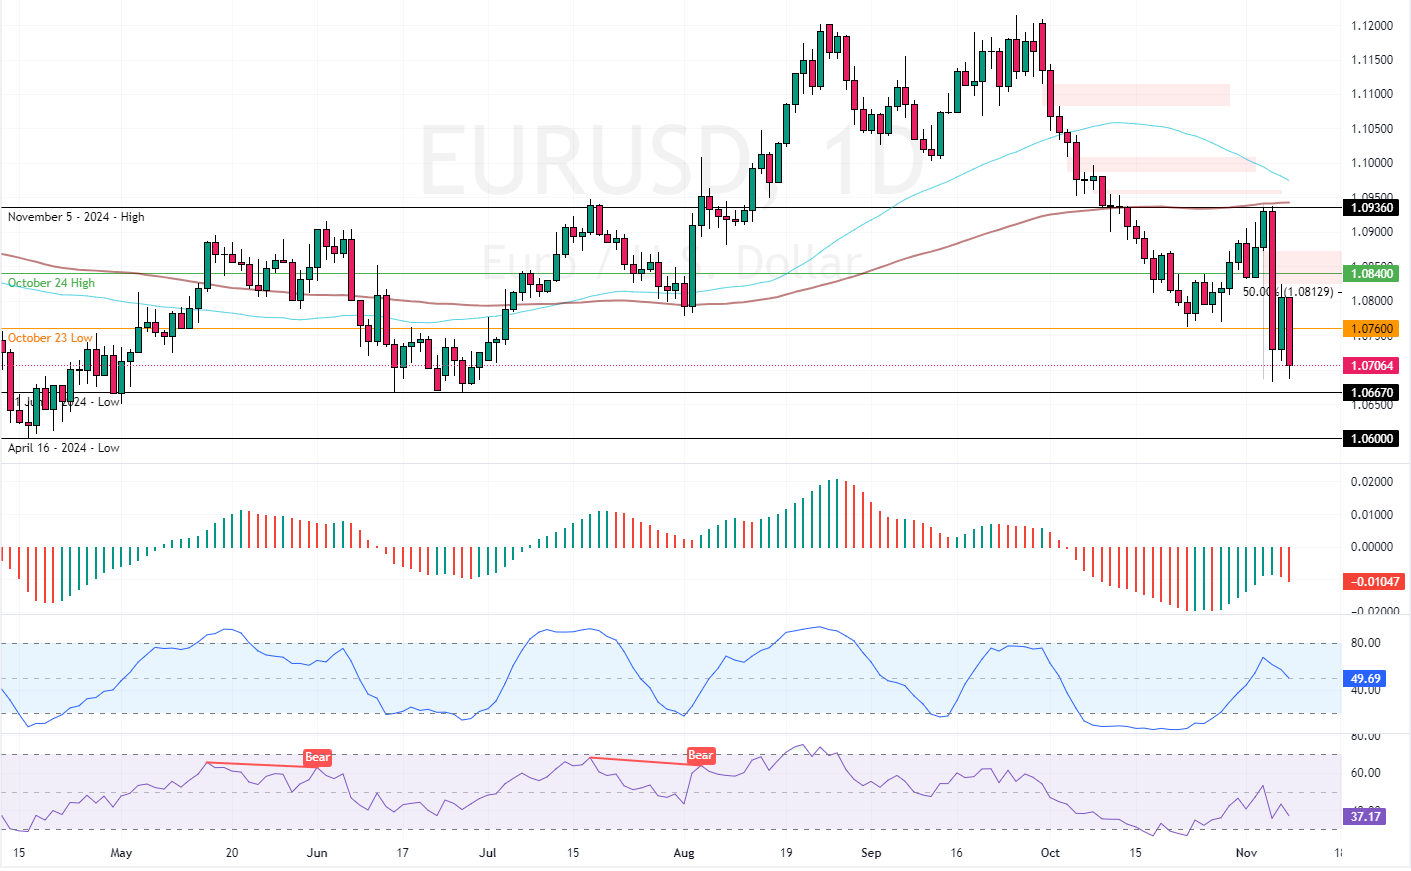
FxNews—EUR/USD resumed its downtrend trajectory after it tested the 50% Fibonacci retracement level as resistance at the 1.081 mark. This demand zone was backed by the bearish fair value gap and the 100-period simple moving average, making it a robust bullish barrier.
As of this writing, the currency pair trades at approximately 1.069, speeding toward the June 21 low of 1.066.
EURUSD Technical Analysis – 8-November-2024

The European currency trades bearishly against the Greenback because the exchange rate is below the 50- and 100-period simple moving averages. Additionally, the Awesome Oscillator histogram is below the zero line, with the value dropping, indicating that the bear market is strengthening.
That said, the Stochastic and RSI depict values of 41 and 32 in the description, respectively, suggesting that EUR/USD is not yet oversold, so the downtrend should resume.
Overall, the technical indicators suggest that the primary trend is bearish and should continue.
EURUSD Forecast – 8-November-2024

The outlook for the EUR/USD trend remains bearish as long as the price is below the 100-period moving average or the 1.084 mark (October 24 high). That said, the bears are likely to push the price toward the 1.066 mark, a critical support level aligning with the June 21 Low.
Furthermore, if the selling pressure pushes the price below 1.066, the EUR/USD’s downtrend could extend to the 1.06 mark (April 16 Low). Please note that the EUR/USD bearish strategy should be invalidated if the price exceeds $1.084.
- Support: 1.066 / 1.06
- Resistance: 1.075 / 1.084


