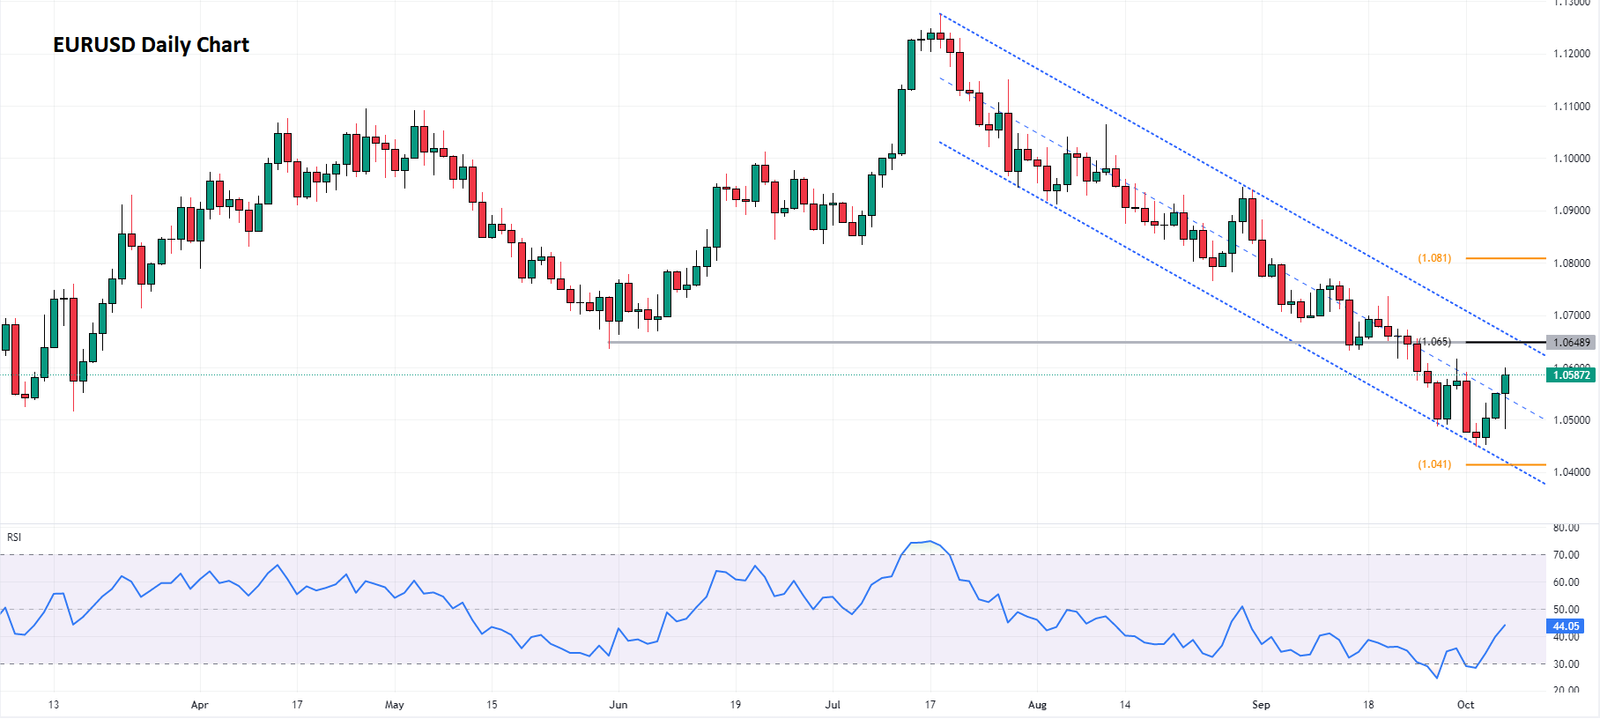
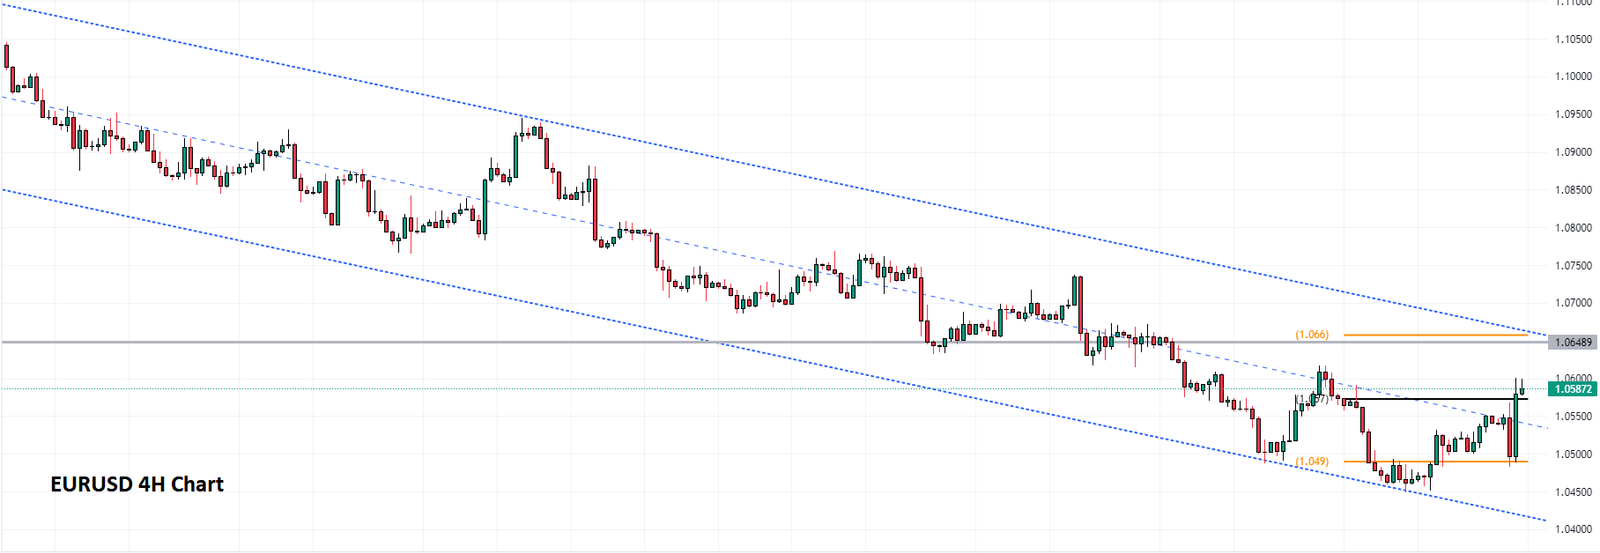
Our EURUSD Technical Analysis observed that the EURUSD pair hit a new low for 2023 at 1.0447, recovering some of its weekly losses to close around 1.0520. The strength of the US Dollar remained intact due to ongoing worries about the future economy despite a mid-week correction triggered by extreme overbought conditions.
EURUSD Fundamental Analysis
The key takeaway is that government bond yields reached multi-year peaks while stock markets suffered significant losses. This is due to persistent inflationary pressures and a labor market that isn’t as tight as expected, providing the Federal Reserve (Fed) with room to tighten monetary conditions further. Consequently, the US Dollar ended the week on a strong note.
During the first half of the week, investors focused on figures related to economic growth, which unfortunately didn’t lift spirits. S&P Global released the final versions of the September Producer Manager Indexes (PMIs), confirming a significant contraction in the Euro Zone economy in the third quarter of the year. Some indexes saw minor revisions due to backlogs. Conversely, the official US ISM Manufacturing PMI for September came in at 51.2, and the services index at 50.1, indicating sector expansion and demonstrating the resilience of the US economy.

Job Market & Inflation Impact
Reuters – In our EURUSD analysis, we delve into the US employment figures released on Friday, which indicate a tight labor market. This poses a challenge for the Federal Reserve (Fed), which may need to maintain higher rates for an extended period to curb inflation. The Nonfarm Payrolls report revealed an addition of 336,000 new jobs in September, almost twice the market’s expectations. The Unemployment Rate held steady at 3.8%, while the Labor Force Participation Rate was confirmed at 62.8%. These figures propelled the 10-year Treasury yield to 4.887%, its highest since 2007, while the 2-year note yield reached as high as 5.15%, just shy of the multi-year high of 5.20% posted in mid-September.
Next week, inflation will again take center stage as Germany is set to publish the September Harmonized Index of Consumer Prices (HICP), and the US will release the Producer Price Index (PPI) for the same month. Additionally, the US Federal Open Market Committee (FOMC) will publish the minutes of its September meeting on Wednesday.
To conclude, the US will disclose the September Consumer Price Index (CPI) on Thursday, followed by the preliminary estimate of the October Michigan Consumer Sentiment Index on Friday.
EURUSD Market Analysis: A Technical Outlook
Our EURUSD analysis observed that the EURUSD currency pair has closed above the 1.067 pivot. The RSI (Relative Strength Index) indicator, a tool used in technical analysis of financial markets, is currently positioned above the 50 level. This is a key threshold in RSI analysis. When the RSI is above 50, it generally indicates that the market’s trend is strong and upward, often called ‘bullish.’
Given that the pivot point is holding, it’s plausible for the EURUSD to test the significant resistance around 1.0648, which also aligns with the upper band of the downward channel.

Despite these observations, the overall outlook for EURUSD Market Analysis remains bearish. This bearish scenario holds validity as long as the currency pair continues to trade within the declining channel.