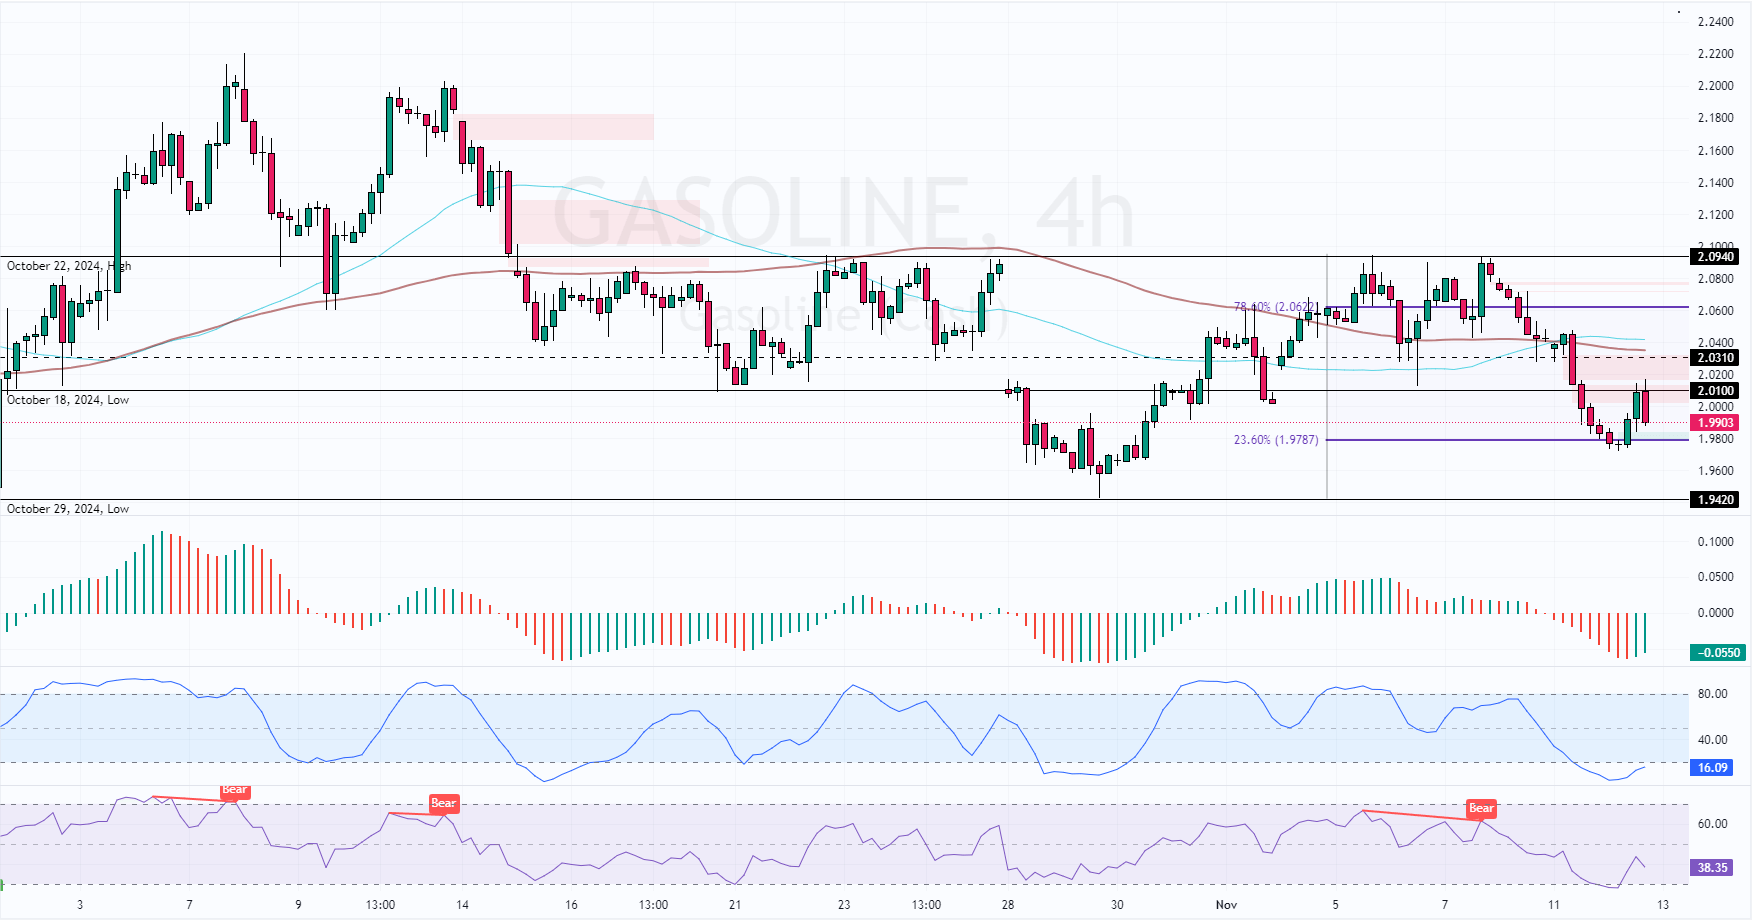
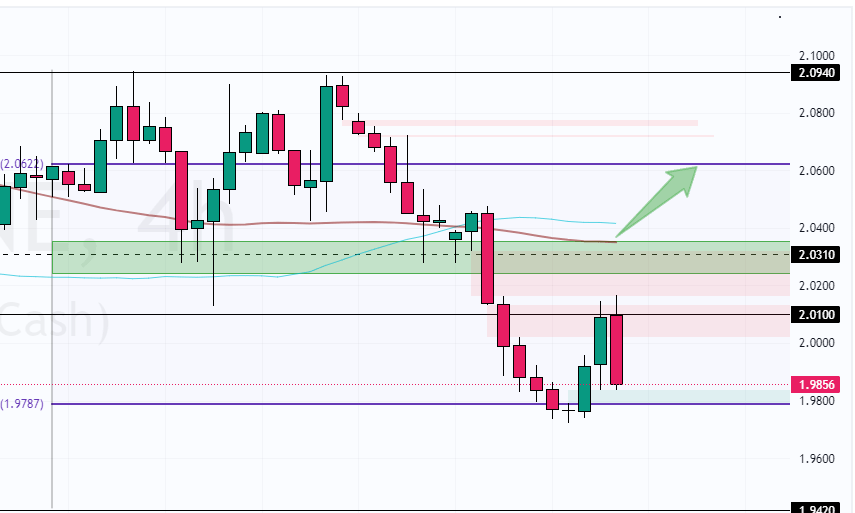
FxNews—The Gasoline is in a bear market because the price is below the 50- and 100-period simple moving averages. In today’s trading session, the price bounced off the 23.6% Fibonacci retracement level ($1.97) and tested the 2.01 critical resistance (October 18 Low).
However, today’s bullish momentum paused after the price tested the resistance. As of this writing, gasoline prices have declined, trading at approximately $1.99.
Gas Prices Retreat from $1.97

Today’s pullback from $1.97 was anticipated because the Stochastic and RSI 14 indicators were hovering in oversold territory. Additionally, today’s uptick in momentum was backed by the Awesome Oscillator’s green bars.
Overall, the technical indicators suggest that while the primary trend is bearish, the gasoline price can potentially erase some of its recent losses.
Gasoline Prices Bearish Below $2.031

From a technical perspective, the bearish trend remains valid as long as the prices are below the 100-period simple moving average at $2.03, backed by the bearish fair value gap. That said, immediate support is at the 23.6% Fibonacci, the 1.97 mark.
The downtrend will likely resume if bears close and stabilize the price below 1.97. In this scenario, the next bearish target could be the October low at 1.94.
The Bullish Scenario

Conversely, the bearish strategy should be invalidated if bulls pull the Gasoline prices above $2.03. If this scenario unfolds, the current uptick momentum could extend to the %78.6 Fibonacci at $2.06.
- Support: 1.97 / 1.94
- Resistance: 2.03 / 2.06