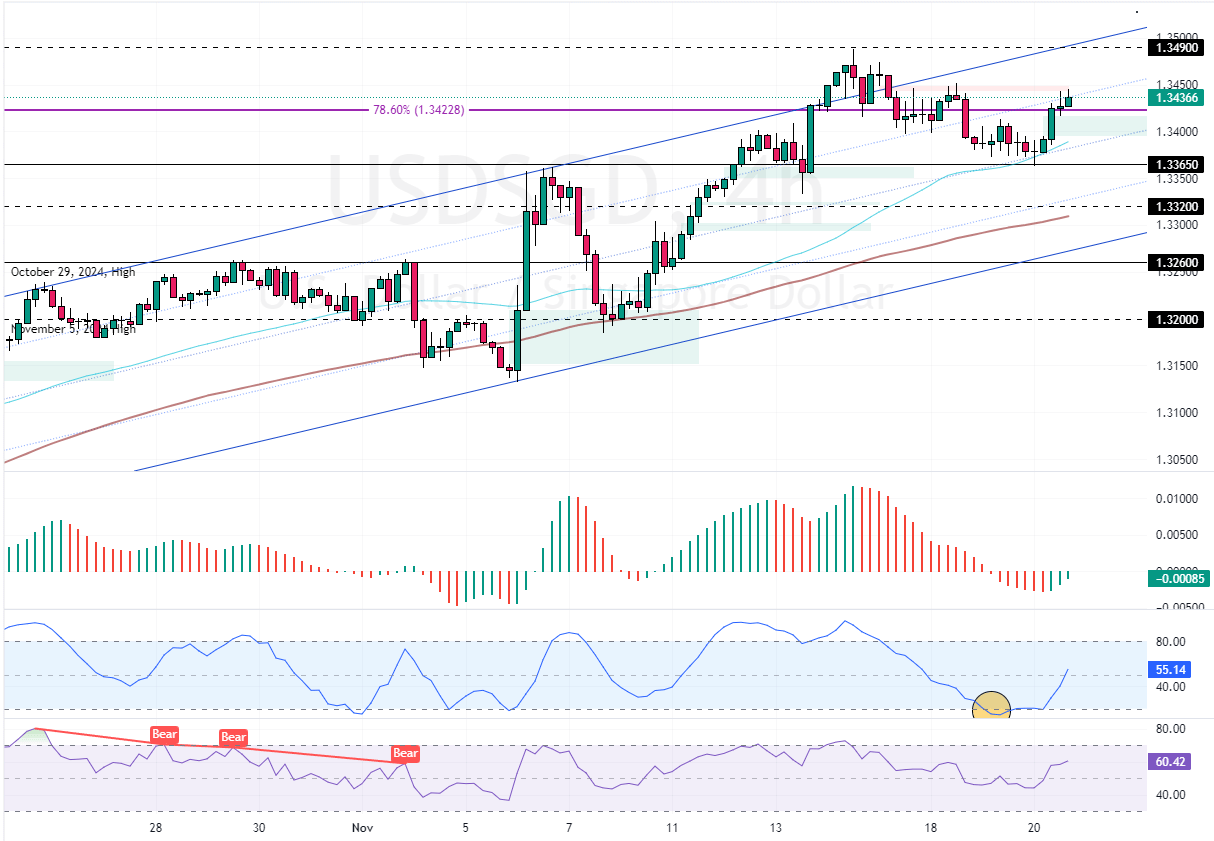
FxNews—The Greenback traded in a bull market against the Singapore dollar at approximately 1.343 in today’s trading session. The uptrend trajectory began after USD/SGD bears tested the 50-period simple moving average as support. Consequently, the prices bounced, currently stabilizing above the 78. 6% Fibonacci level.

USDSGD Technical Analysis
As for the technical indicators, the Awesome Oscillator histogram is green, closing the zero line from below. Additionally, the Stochastic and RSI depict 55 and 60 in the description, respectively, meaning the bull market strengthens.

Overall, the technical indicators suggest the primary trend is bullish and should resume.
USDSGD Forecast
The immediate support rests at 1.336, backed by the 50-period simple moving average. Above this support, the outlook for the USD/SGD trend remains bullish, and the next target could be revisiting the 1.349 mark. Furthermore, if the buying pressure exceeds 1.349, the next bullish target could be 1.355.
Please note that the bullish strategy should be invalidated if USD/SGD dips below the 1.336 support.
Also read: USDCNH Nears 3-Month High as US Tariff Worries Mount
USDSGD Support and Resistance Levels
Traders and investors should closely monitor the key levels below to make informed decisions and adjust their strategies accordingly as market conditions shift.
- Support: 1.336 / 1.332 / 1.326
- Resistance: 1.349 / 1.355 / 1.36

J.J Edwards is a finance expert with 15+ years in forex, hedge funds, trading systems, and market analysis.

