FxNews—Gold held steady at around $2,680 per ounce on Friday following the Federal Reserve’s decision to cut interest rates by a quarter point after a two-day meeting. This adjustment brought the federal funds rate down to 4.50%-4.75%—the second rate cut of the year. Policymakers cited a slight cooling in the job market and acknowledged that while inflation is nearing the Fed’s 2% target, it remains above desired levels.
Fed to Wait on Data for Rate Decisions Powell Avoids Hints
During his press conference, Fed Chair Jerome Powell avoided giving specific guidance on future rate adjustments, emphasizing that the Fed would remain flexible and respond to upcoming economic data. Powell also mentioned that the recent presidential election results, including policies related to tariffs, tax cuts, and potential immigration changes, are unlikely to affect the Fed’s short-term policy decisions.
Gold Technical Analysis – 8-November-2024

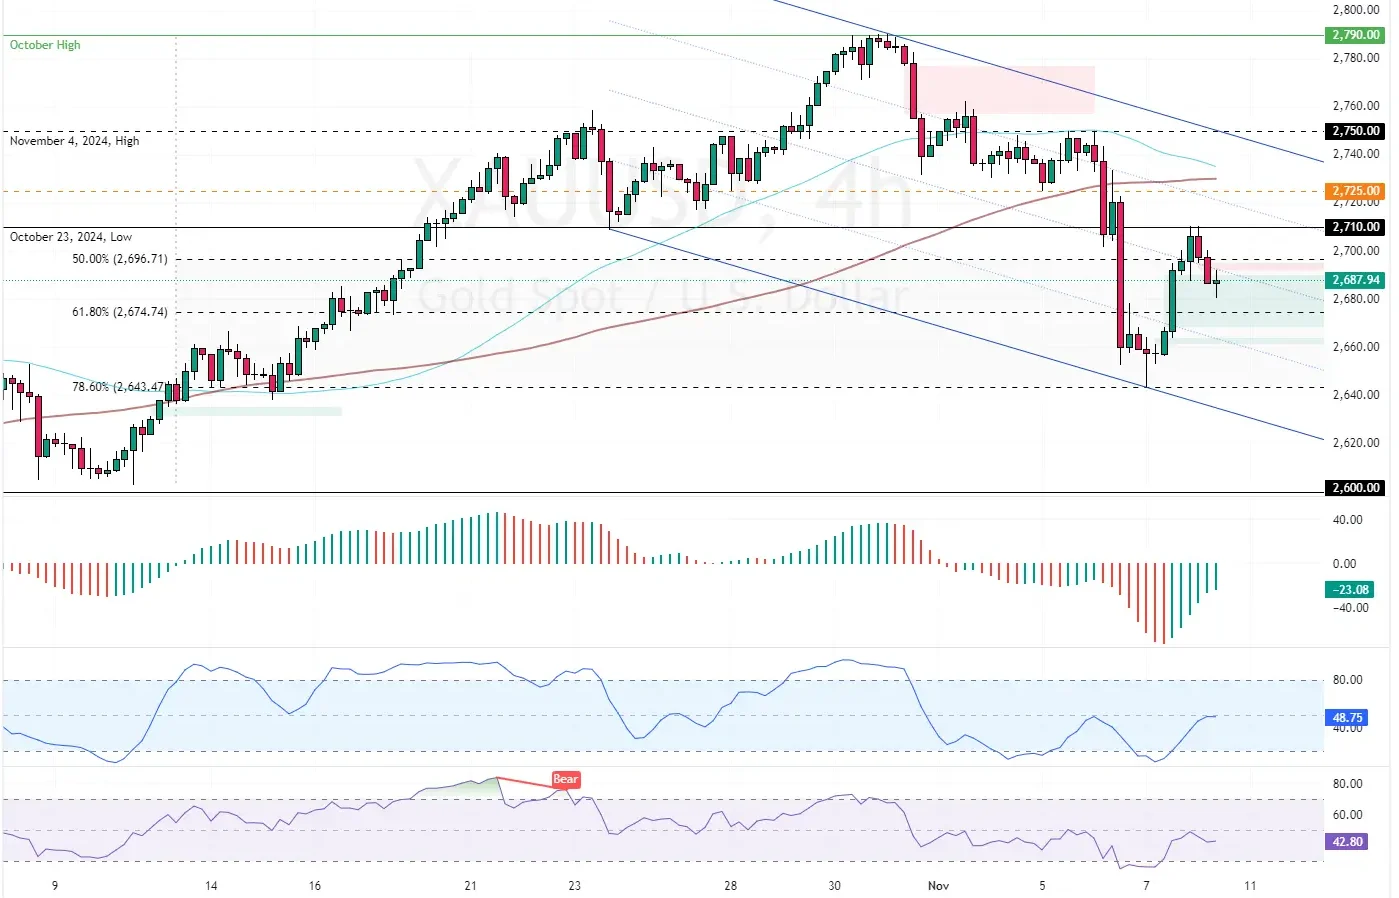
In yesterday’s trading session, the XAU/USD pair bounced from the 78.6% Fibonacci retracement level. The bullish wave eased when Gold hit the October 23 high at $2,710. As of this writing, the yellow metal trades at approximately $2,690, stabilizing below the %50 Fibonacci level.
As for the technical indicators, the Awesome Oscillator bars are green, approaching the zero line from below, demonstrating bullish momentum. Additionally, the Stochastic Oscillator depicts 48 in value and rising, meaning the bull market strengthens. However, the RSI 14 value is below the median line, meaning the bear market is not too weak.
Overall, the technical indicators suggest the primary trend is bearish because the price is below the 50-period simple moving average, but bulls have the potential to raise the price.
Gold Price Forecast – 8-November-2024

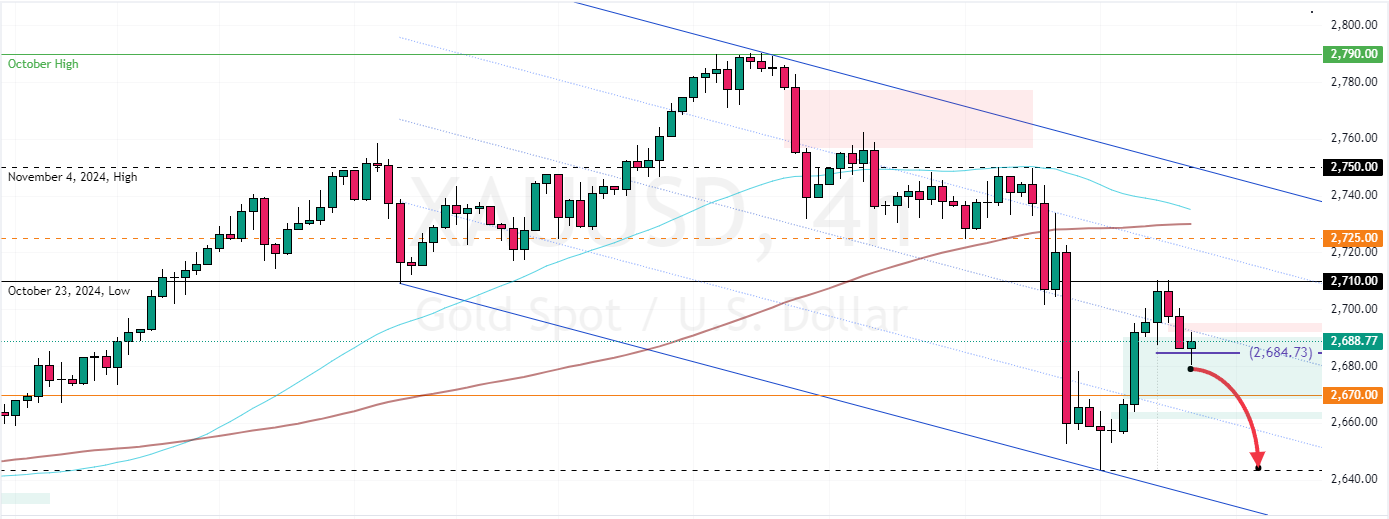
The immediate resistance is at $2,710, and the immediate support is at $2,685. From a technical perspective, the downtrend will likely resume if bears close the Gold price below the immediate support with a full-bodied bearish candlestick.
In this scenario, XAU/USD’s downtrend would be triggered with its next target at $2,670, backed by the bullish Fair Value Gap area. Furthermore, if the selling pressure exceeds $2,670, the downtrend could extend to $2,640, the 78.6% Fibonacci retracement level.
Gold Bullish Scenario
Conversely, the bullish wave that began yesterday would target the 100-period simple moving average ($2,725) if bulls pull the gold price above the immediate resistance ($2,710).
- Support: 2,670 / 2,640 / 2,600
- Resistance: $2,710 / $2,725 / $2,750