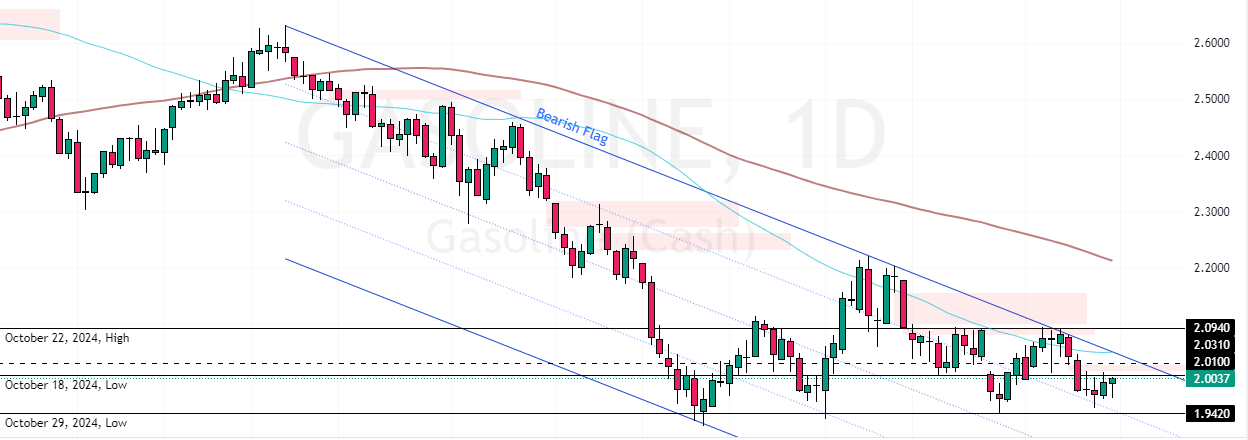
FxNews—Gasoline prices began a new bearish wave from the October 18 high, the 2.01 mark, despite the EIA’s report on a significant supply decline. Last week, gasoline stocks decreased by 4.4 million barrels, bringing total reserves to 206.9 million. The recent downturn in Gasoline prices could be due to lower demand in the U.S. as the weather gets colder and fewer people use their cars for traveling.

Furthermore, the Gasoline price is highly influenced by the Crude oil price, which trades for less than $68 per barrel. This is mostly because China demands less oil, and the supplies in the United States oil production hit a high record of 13.40 million barrels daily in August.
Gasoline Analysis – 15-November-2024

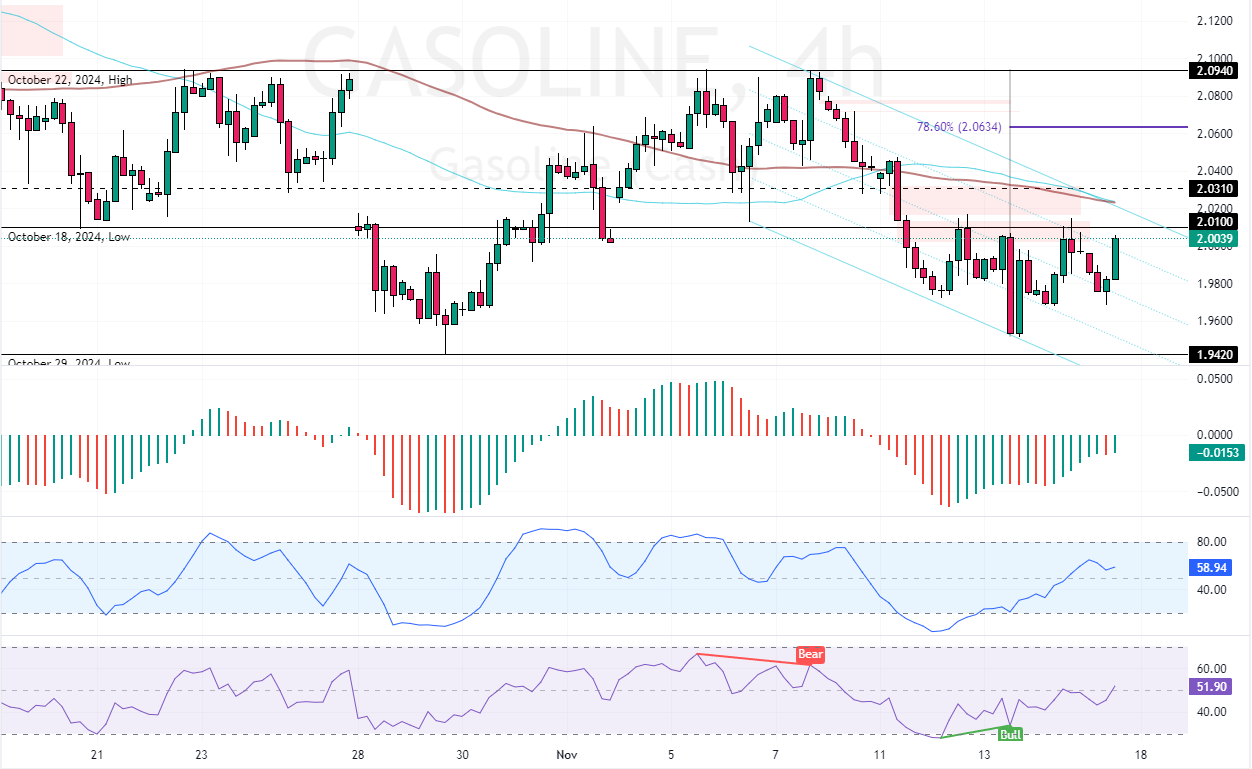
The recent depreciation of Gasoline prices was signaled by the RSI divergence in the 4-hour chart, as the image above shows. As of this writing, the commodity in discussion trades at approximately $2.0, heading toward the immediate resistance, the October 18 low at $2.01.
As for the technical indicators, the Awesome Oscillator is nearing the signal line from below with a green histogram, meaning the bull market is strengthening. Additionally, the Stochastic oscillator depicts 58 in the description, meaning the Gasoline market is not overbought, and the current uptick momentum can potentially resume.
Watch for New Lows if Gasoline Holds at $2.03

Please note that the outlook of the Gasoline price trend remains bearish because prices are below the 100-period moving average. Therefore, a new bearish trend might begin if the critical resistance level at $2.03 holds firm. In this scenario, the prices could dip to the October 29 low at $1.94.
Conversely, the bearish strategy should be invalidated if the Gasoline prices exceed $2.03, backed by the 100-period SMA. If this scenario unfolds, the current uptick momentum could extend to the %78.6 Fibonacci retracement level at $2.06.
- Support: 1.94 / 1.9
- Resistance: 2.01 / 2.03 / 2.06