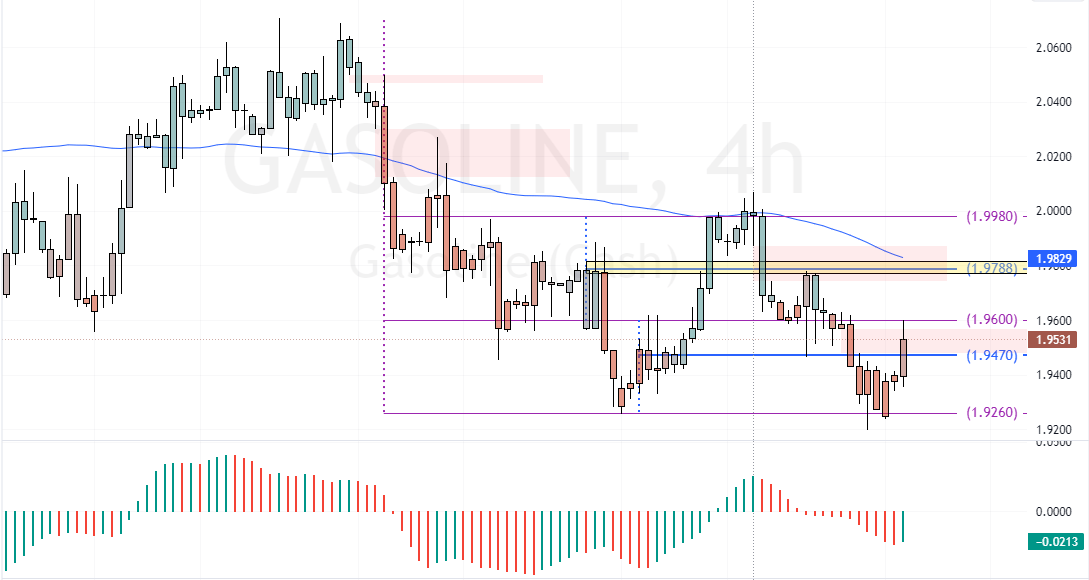
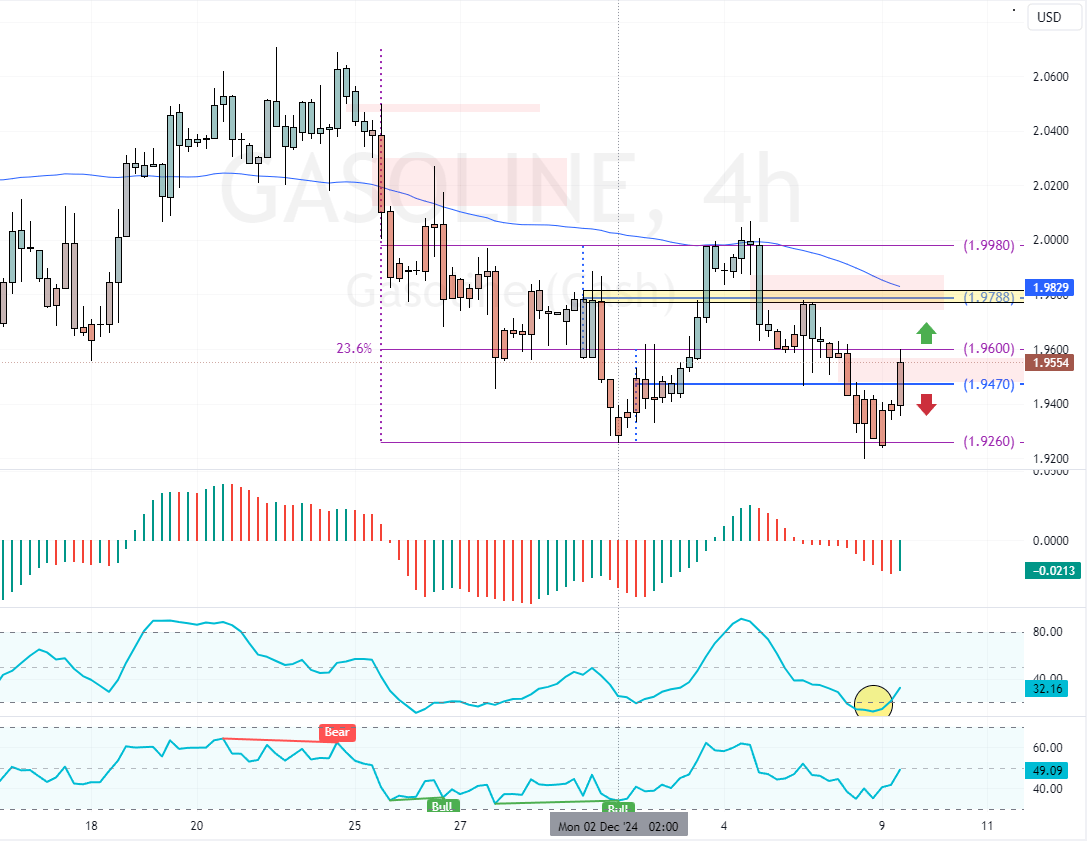
Gasoline prices rose from $1.92 (December 2, low) to approximately $1.96, testing the 23.6% Fibonacci level as resistance.
- OPEC+ delaying production increases until Q1 2025
- Concern over excess oil supply next year
- Close monitoring of China’s potential economic stimulus
- US crude stockpiles falling while gasoline inventories grow

OPEC+ Policies Shape Future Supply Outlook
The OPEC+ association plans to maintain its oil output through early 2025 before raising production starting next April. These gradual shifts are designed to prevent a severe oversupply, reflecting the group’s cautious approach to balancing energy markets and stabilizing prices.
Gasoline Prices Technical Analysis

Gasoline prices rose from $1.92 (December 2, low) to approximately $1.96, testing the 23.6% Fibonacci level as resistance.
The immediate resistance is at $1.96, the 23.6% Fibonacci retracement level. Meanwhile, the Awesome Oscillator and Stochastic demonstrate rising bullish sentiment in the market.
- The AO’s bars are below the signal line. But the recent bar turned green.
- The Stochastic Oscillator stepped outside the oversold territory, strengthening the bull market.
Despite the momentum indicators, Gasoline’s market outlook remains bearish. It is below the critical resistance of $1.98, backed by the 50-period simple moving average. From a technical perspective, if gasoline prices hold above the immediate support of $1.947, they could target $1.978.
Conversely, a dip below $1.947 will likely trigger the downtrend. In this scenario, sellers could revisit the December 2 low at $1.92.