FxNews—In today’s comprehensive GBPAUD Forecast, we will first scrutinize the current economic conditions in the United Kingdom and Australia. Then, we will meticulously delve into the details of the technical analysis of the GBP/AUD pair.
US Economy News
Bloomberg – The British pound, also known as the sterling, is currently steady at around $1.215. People are waiting for important job data and PMI flash numbers, which are due on Tuesday. They’re also looking at various economic signs that give a detailed picture of the UK’s economy and how it might affect the Bank of England’s plans for managing money.
In September, sales in UK shops decreased by 0.9% from the previous month, more than the expected drop of 0.2%. Other information shows that inflation, or the rate at which prices rise, is still high even though the Bank of England has raised interest rates.
Last Friday, Andrew Bailey, who is in charge of the Bank of England, talked about the inflation numbers for September. These numbers didn’t go down as much as most experts thought they would. But Bailey said these numbers were close to the bank’s predicted. He also said it was good news that core inflation, a measure of inflation that leaves out certain items with volatile prices, had decreased a bit.
Finally, on Friday, Moody’s, a company that rates countries based on their likelihood of repaying their debts, changed its outlook for Britain from “negative” to “stable.”
Australia Economy News
The Australian dollar, often called the “Aussie,” has maintained its recent drop to around $0.63, close to the lowest it’s been in a year. This is happening because of problems in the Middle East that are causing investors to put their money in safer places instead of riskier currencies.
People are also being careful because an important report on inflation in Australia is coming out this week. In addition, Michelle Bullock, who leads the Reserve Bank of Australia, is expected to speak twice, and people think she will discuss what the inflation report means for the bank’s plans.
At the same time, the minutes from the last meeting of the Reserve Bank of Australia showed that they considered raising their policy rate in October. However, they decided to keep it at 4.1% because they didn’t have enough new information. The bank noted that inflation was still much higher than their target of 2%, and they think it will stay that way for a while. However, they also said that growth in jobs and output in Australia might have reached its highest point.
GBPAUD Forecast – Bulls Face Resistance
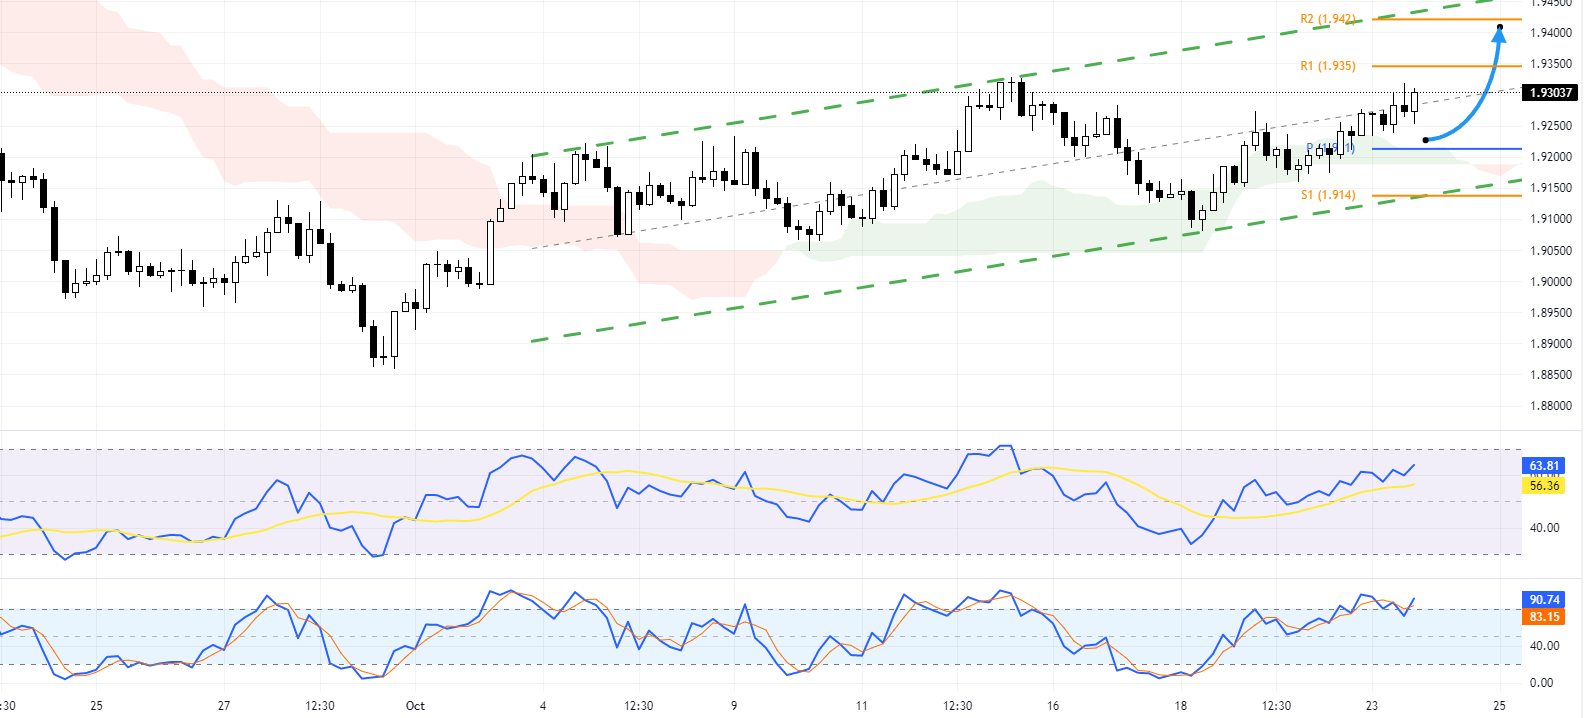
The GBPAUD currency pair exhibits a bullish trend as it navigates within an upward channel. This trend is heading towards the first level of resistance, commonly referred to as R1. However, it’s important to note that the stochastic oscillator, a popular momentum indicator used in technical analysis, is currently in the overbought zone. This suggests that the upward momentum might start to slow down.

In the 4-hour chart, the trend outlook remains bullish, with the GBPAUD pair trading above the Ichimoku cloud. This technical analysis tool defines support and resistance levels and generates trading signals. Furthermore, as long as the GBPAUD price remains above the pivot line, we can anticipate that the bulls’ target will be the second resistance level (R2) at 1.942.
On the flip side, we should also consider the lower line of the bullish channel, which acts as a support level. If this level breaks, it would invalidate the current bullish outlook. This scenario underscores the importance of monitoring these key levels, which are crucial in determining future price movements.
In conclusion, while the current trend for GBPAUD is bullish, traders should monitor key technical indicators and price levels for potential changes in the trend direction. Remember, successful trading involves careful analysis and risk management.