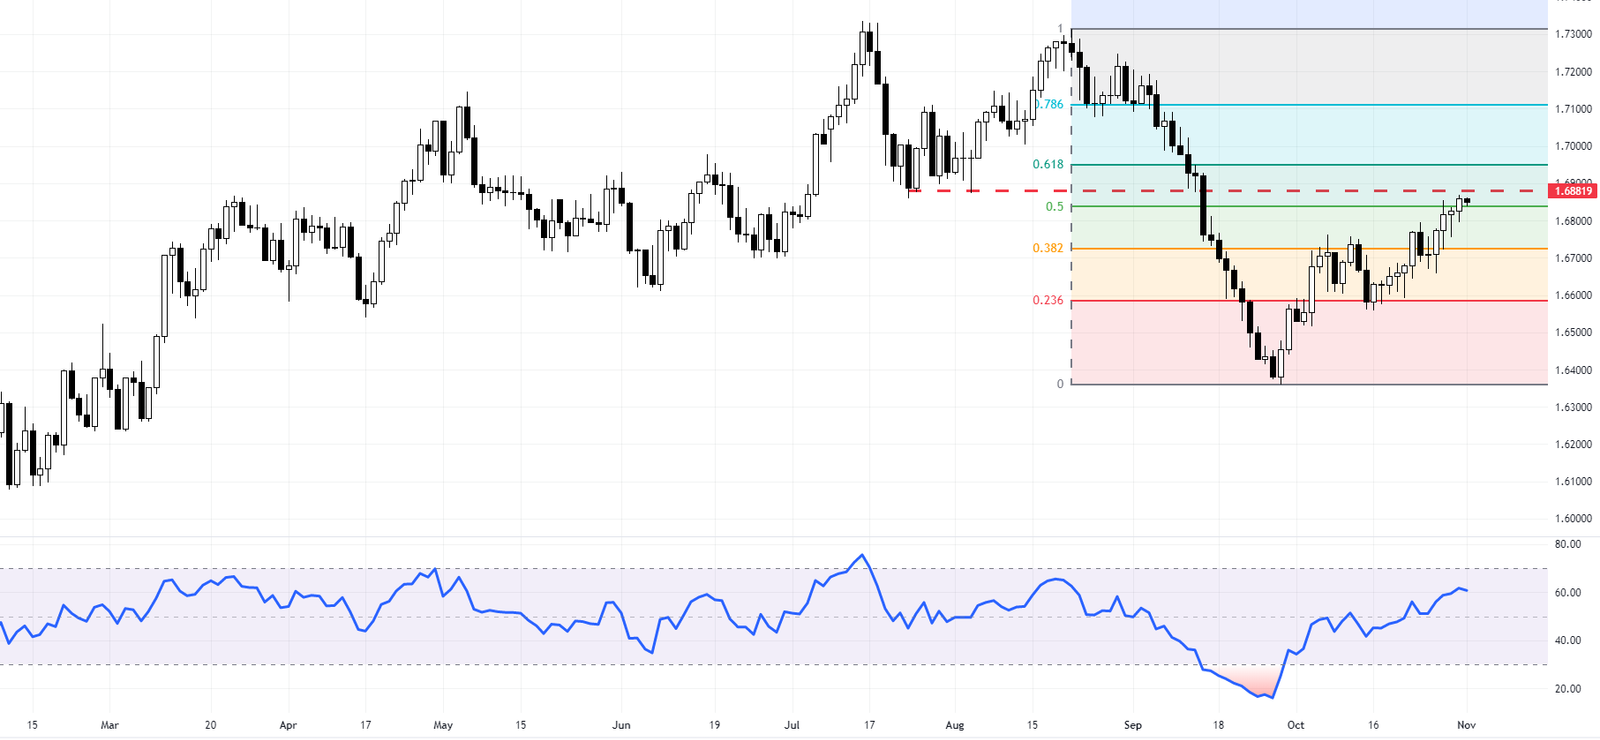
The GBPCAD pair has recently shown promising signs, closing above the critical 50% Fibonacci retracement level, hinting at a potential uptrend. This level, near the significant resistance mark at 1.688, is a key focal point for traders monitoring this currency duo. As we delve deeper into the GBPCAD forecast, it’s worth noting that the Relative Strength Index (RSI) suggests ample space before reaching the overbought territory.
GBPCAD Forecast – A Technical Analysis Deep Dive
This margin allows the growth trajectory to extend towards the 61.8% Fibonacci level, a classic target for traders relying on technical analysis.

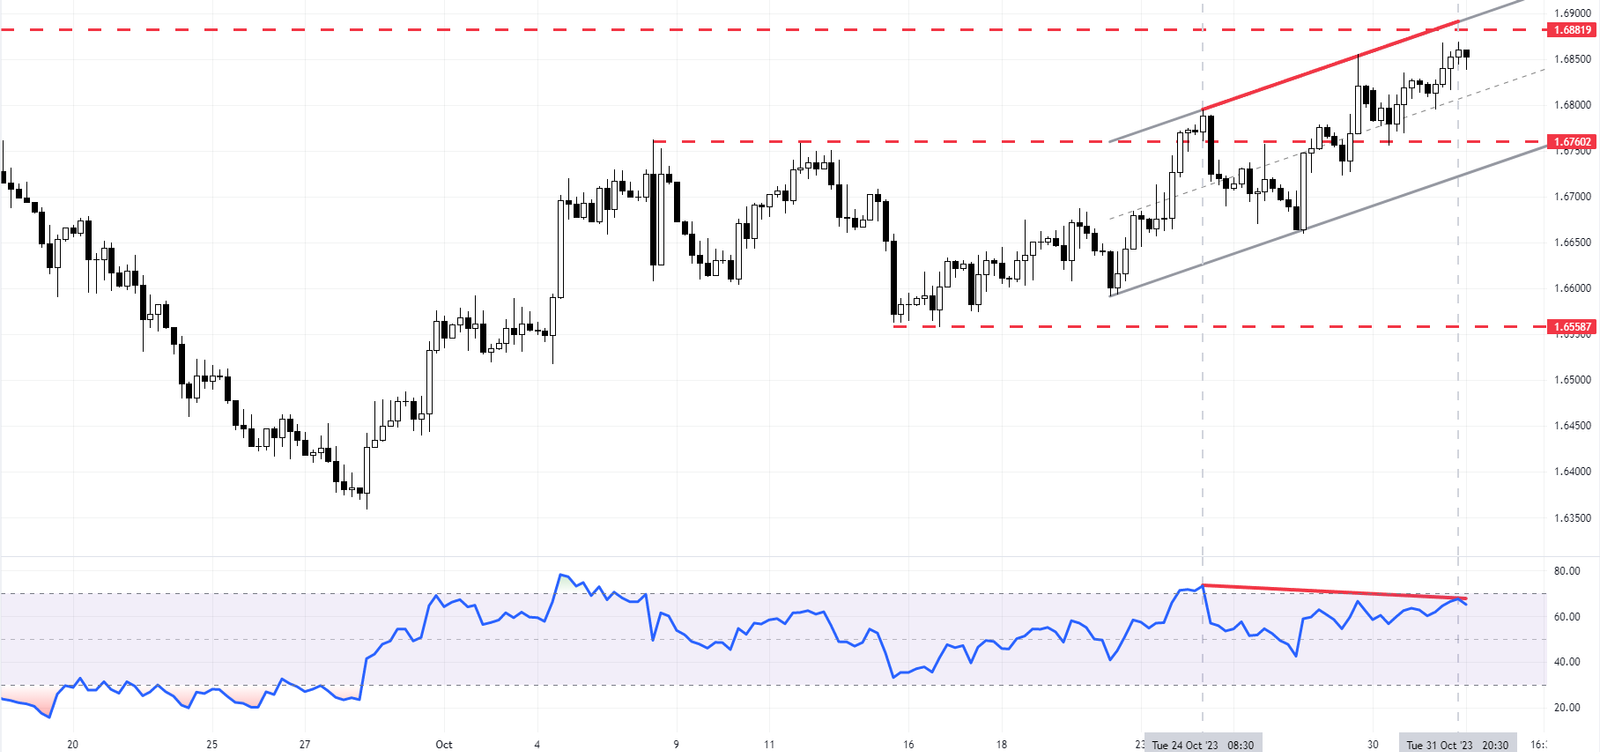
GBPCAD Forecast: 4H Chart
Enhancing our perspective with a granular view, the 4-hour (4H) chart offers a more detailed insight into the GBPCAD’s behavior. Within this timeframe, the pair has consistently traded within a bullish channel, reinforcing the optimistic outlook.
However, the RSI on this scale is nearing the overbought zone and is exhibiting signs of divergence. This divergence could be a precursor to a shift in momentum, signaling traders to brace for potential corrections.

The anticipated correction could see the GBPCAD pair retracing back to the median line of the current bullish channel. This pullback would naturally respond to the pair’s rapid ascent and offer traders a strategic entry point. The subsequent move to watch would be a retest of the broken support level around 1.68, a crucial juncture that could determine the pair’s short-term direction.
Should the GBPCAD sustain its momentum and break past the 1.6881 resistance, it would set a new precedent for the pair’s upward potential. Traders should watch the interplay between the RSI readings and the price action, as this could offer valuable clues to the pair’s strength and sustainability of the current trend.