Friday, November 22, 2024
0.8 C
London

GBPCAD Forecast – Bull Market Opportunity Ahead

The Pound Sterling resumed its bullish momentum from 1.70 against the Canadian currency. The uptick in velocity escalated in today’s trading session after the bears failed to close the price below the %38.2 Fibonacci retracement level (1.709) on Friday.

As of writing, the GBPCAD pair trades at about 1.71, approaching the descending trendline, shown in blue in the daily chart below.

GBPCAD Daily Chart
GBPCAD Daily Chart

GBPCAD Technical Analysis

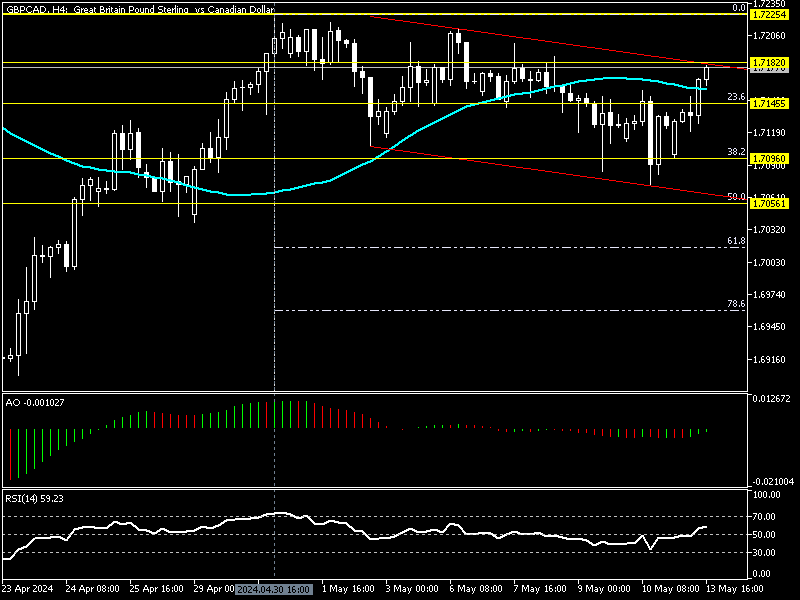
We zoomed into the 4-hour chart to dissect the technical indicators, trend direction, and price action on the GBPCHF currency pair. Analyzing the market in a lower time frame is essential for forecasting the next price move and marking potential entry and exit points in trading.
GBPCAD Technical Analysis

The technical indicators in the 4-hour chart support the current uptrend. The awesome oscillator bars green, approaching the signal line, and RSI hovers above the median line. Notably, the relative strength index value is 58, meaning there is room for the indicator to become oversold.

GBPCAD Forecast – Bull Market Opportunity Ahead
GBPCAD Forecast - Bull Market Opportunity Ahead
GBPCAD Forecast – Bull Market Opportunity Ahead

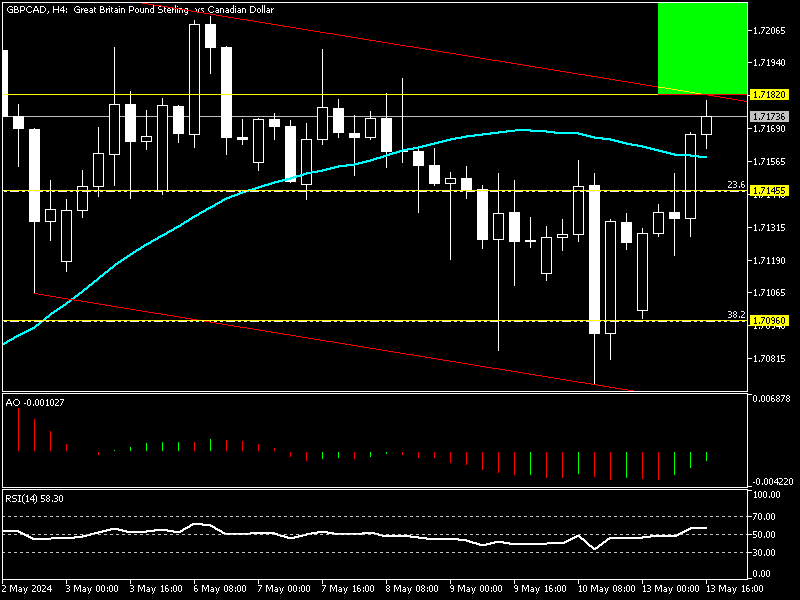
Analysts at FxNews are optimistic that the uptrend will break the descending trendline in red. From a technical standpoint, a firm cross above the trendline can provide a short-term opportunity to join the bull market, with 1.722 as the initial target.

The support level for the bullish scenario is the %23.6 Fibonacci retracement level (1.714). If the price is above 1.714, the bullish forecast stands correct. We suggest traders and investors closely monitor the 1.718 resistance for a breakout.

GBPCAD Bearish Scenario
GBPCHF Bearish Scenario

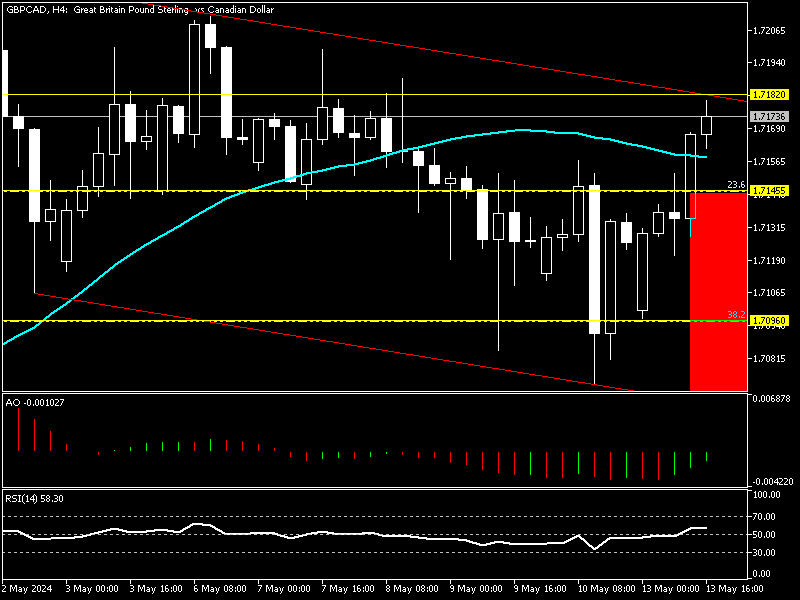
Conversely, if the Pound sterling value becomes cheaper than 1.714 against the Canadian Dollar, the downtrend started on April 30 from 1.722 will likely retest %38.2 Fibonacci followed by the lower band of the bearish flag, the 1.705 mark.

Latest Posts

NATGAS Rises 5.4% Amid Cold Weather and Geopolitical Tensions

Over the past two days, natural gas prices in...

GBPJPY Dips as Ueda Hints at Rising Interest Rates

Governor Kazuo Ueda of the Bank of Japan announced...

EURJPY Drops from 165 as STOXX 50 Falls

The European stock markets experienced declines. The STOXX 50...

Crude Oil Prices Test $69.5 Amid Escalating Global Tensions

WTI crude oil futures rose to approximately $69.5 per...

USDCHF Rises Amid Unexpected Drop in Swiss Inflation

The USD/CHF pair bounced from the %50 Fibonacci retracement...

NATGAS Rises 5.4% Amid Cold Weather and Geopolitical Tensions

Over the past two days, natural gas prices in...

Crude Oil Prices Test $69.5 Amid Escalating Global Tensions

WTI crude oil futures rose to approximately $69.5 per...

Gold Surges Above $2650 as Russia-Ukraine War Escalates

Gold prices exceeded the 38.2% Fibonacci level, trading at...

Gas Prices Near Year High as Cold Snap Threatens Europe

Prices for European natural gas futures approached €47 per...

U.S. Gasoline Futures Hit Two-Week High at $2.05

Gasoline futures in the U.S. peaked at $2.05 per...

Silver Rally Halts at $31.4 Amid Solar Panel Surplus

FxNews—Silver prices eased to $30 per ounce as the...

Oil Prices Stable $69 as Geopolitical Risks Soar

FxNews—WTI crude oil futures remained above the $66.8 critical...

WTI Crude Dips to $68.5 as Norway Field Restarts

On Tuesday, WTI crude oil futures decreased to $68.5...
spot_imgspot_img