In today’s comprehensive GBPCAD forecast, we will first scrutinize the current economic conditions in Canada. Following that, we will meticulously delve into the details of the technical analysis of the GBP CAD pair.
Canadian Market Dips
On Monday, the S&P/TSX Composite index, a key indicator of the Canadian stock market, fell by more than 0.5% to reach the 19,000 level—its lowest in a year. The drop continues from last week and is due to worries that high-interest rates in North America might hurt the performance of Canadian companies.
Companies involved in mining were hit the hardest in Toronto. People are worried about the industry’s future due to high borrowing costs, pushing down copper prices. At the same time, rising bond yields have made gold less valuable. As a result, Barrick Gold, a major gold mining company, saw its value drop by 2%.
Meanwhile, the price of crude oil fell again, leading to a 0.8% loss for Canadian Natural Resources, a big oil and gas company. Everyone is waiting to see what the Bank of Canada will do this week. (source)
GBPCAD Forecast – Rate Hikes Hit Canadian Market
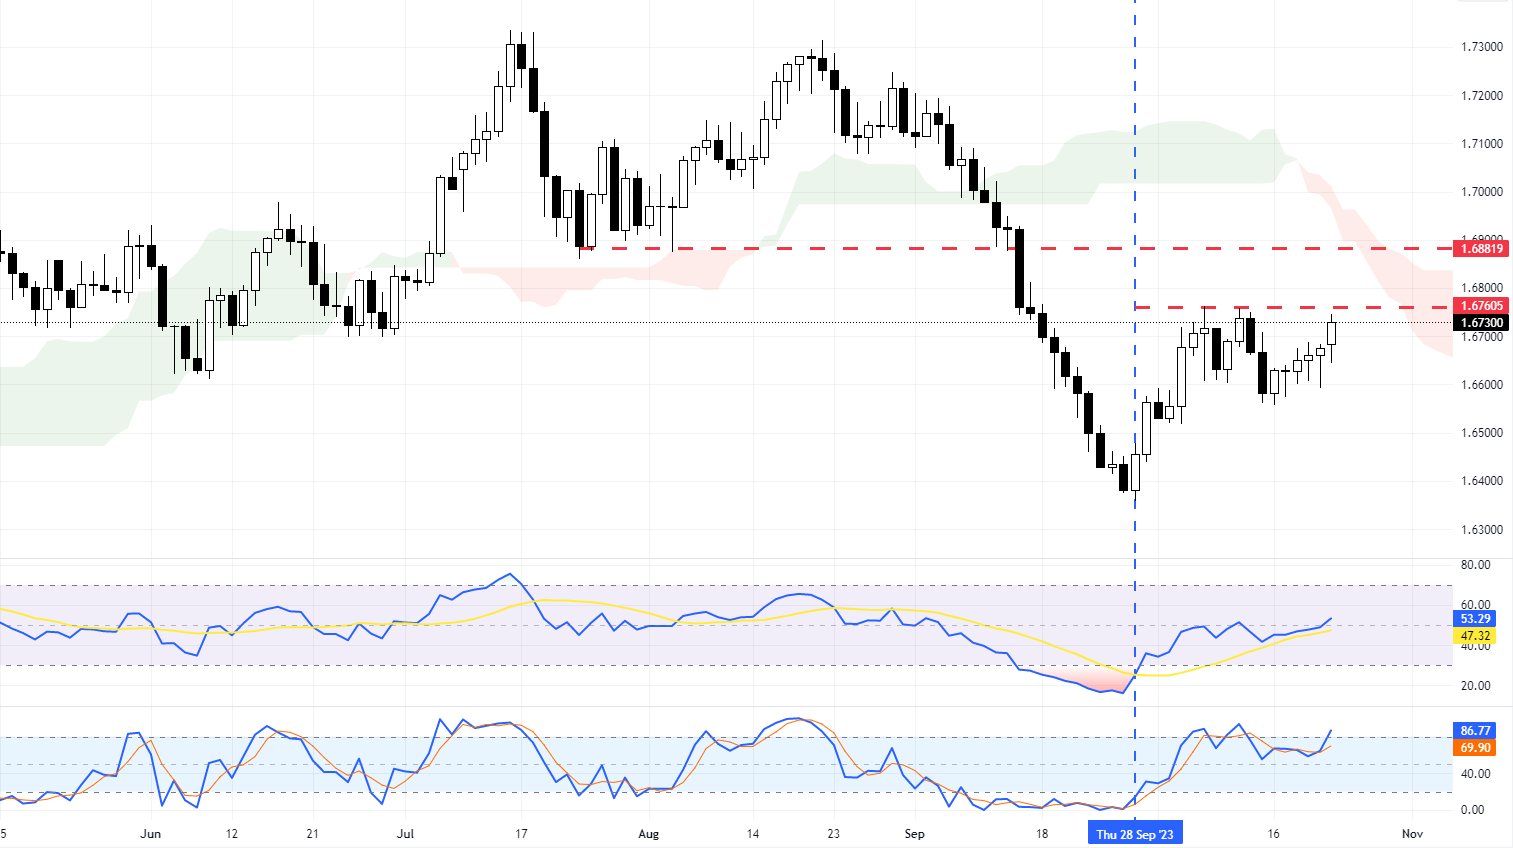
The GBPCAD currency pair has seen its price rise since September 28, reaching the resistance level 1.6760. However, the technical indicators present a mixed picture. The Relative Strength Index (RSI) is just above the 50 level, indicating a bullish market, but the Stochastic indicator is in the overbought zone, suggesting that the market may be overvalued.

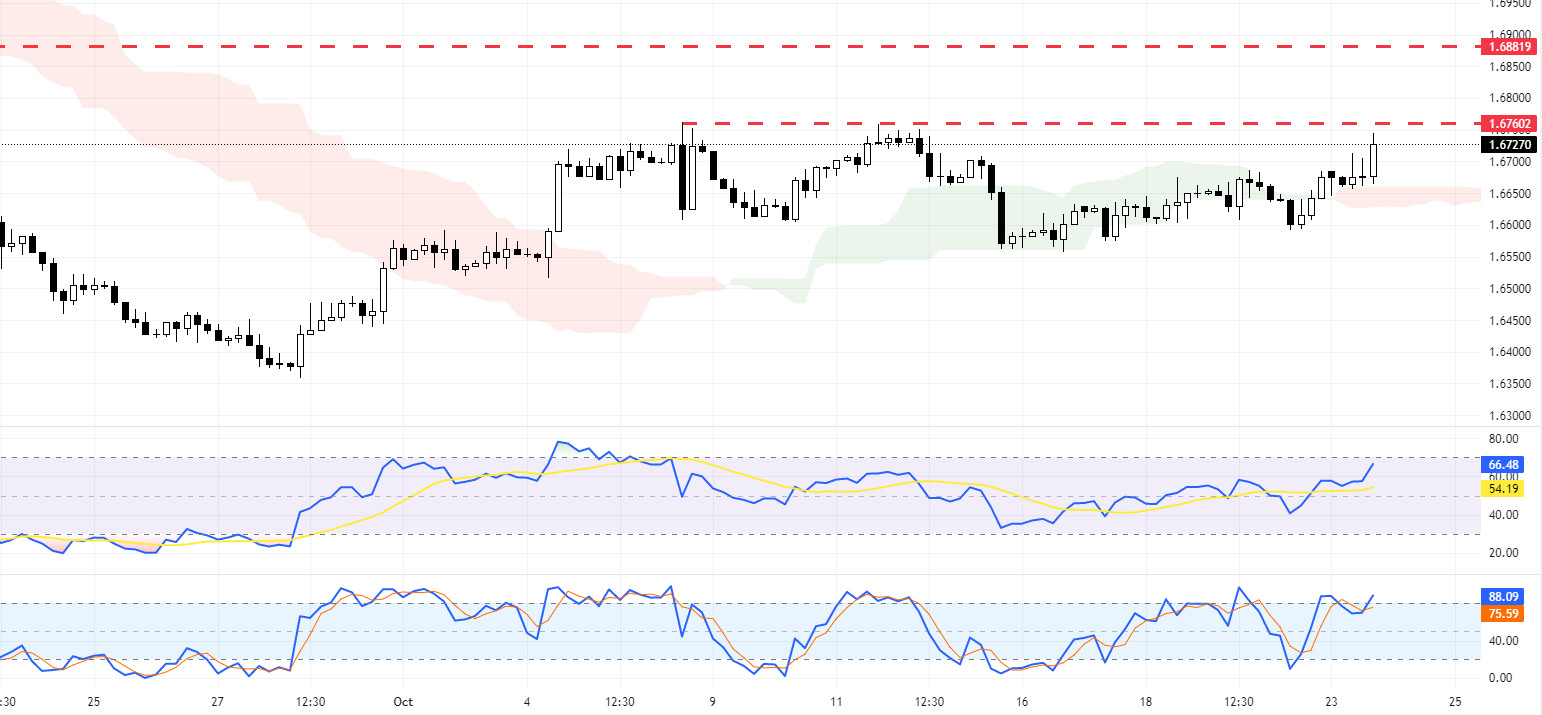
Looking at the 4-hour chart, both the RSI and Stochastic indicators are nearing or overbought. The bulls must break past the 1.676 resistance level to increase prices. If they succeed, the next target would be the 1.688 area.

However, if the resistance at 1.676 holds, we could see a downward trend continuation. Traders and investors should closely watch this level and look for candlestick patterns to make informed trading decisions.
Remember, successful trading involves careful analysis and risk management.