In today’s comprehensive GBPCHF forecast, we will first examine the current economic conditions in the United Kingdom. Then, we will meticulously delve into the details of the technical analysis of the currency pair.
Analysis of UK Manufacturing Health
Bloomberg–October 2023 brought a minor adjustment to the UK’s Manufacturing PMI, now at 44.8, just a touch lower than the initial estimate of 45.2 and slightly below September’s 44.3. This indicates the longest stretch of consistent downturns in production since the 2008/09 period, now in its eighth month. New orders continued to fall for the seventh month, but the decline was not as sharp as the previous month.
The manufacturing sector also saw a reduction in workforce numbers, with a downtrend persisting for over a year. Regarding pricing, the cost of various materials and services like paper, energy, and transportation declined for the sixth month, contributing to a drop in purchase prices.
Conversely, the prices at which goods were sold declined for the fourth month in five. Amidst this, manufacturers’ outlook hit a low not seen in ten months, spurred by worries over uncertain consumer behavior, the rising cost of living, and challenging market conditions.
GBPCHF Forecast – Navigating the Bearish Channel
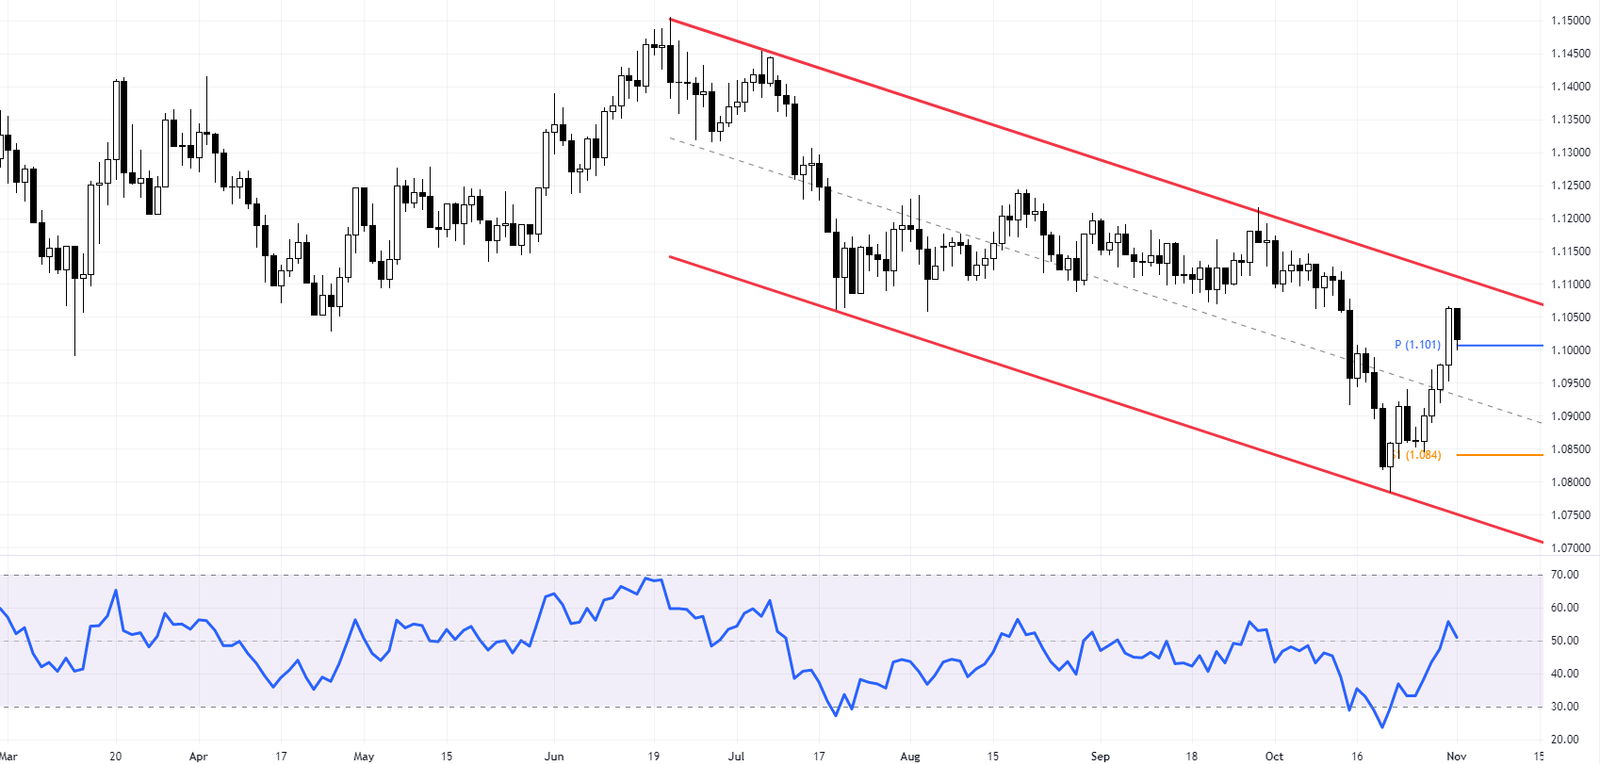
The GBPCHF pair is on a journey. As seen on the daily chart, it’s moving within a bearish channel. Right now, it’s at a crucial point, testing the 1.1 mark. The Relative Strength Index (RSI) is just above neutral, hinting at some balance in the market. The main trend is bearish, but technical indicators suggest we might still be in a correction phase.

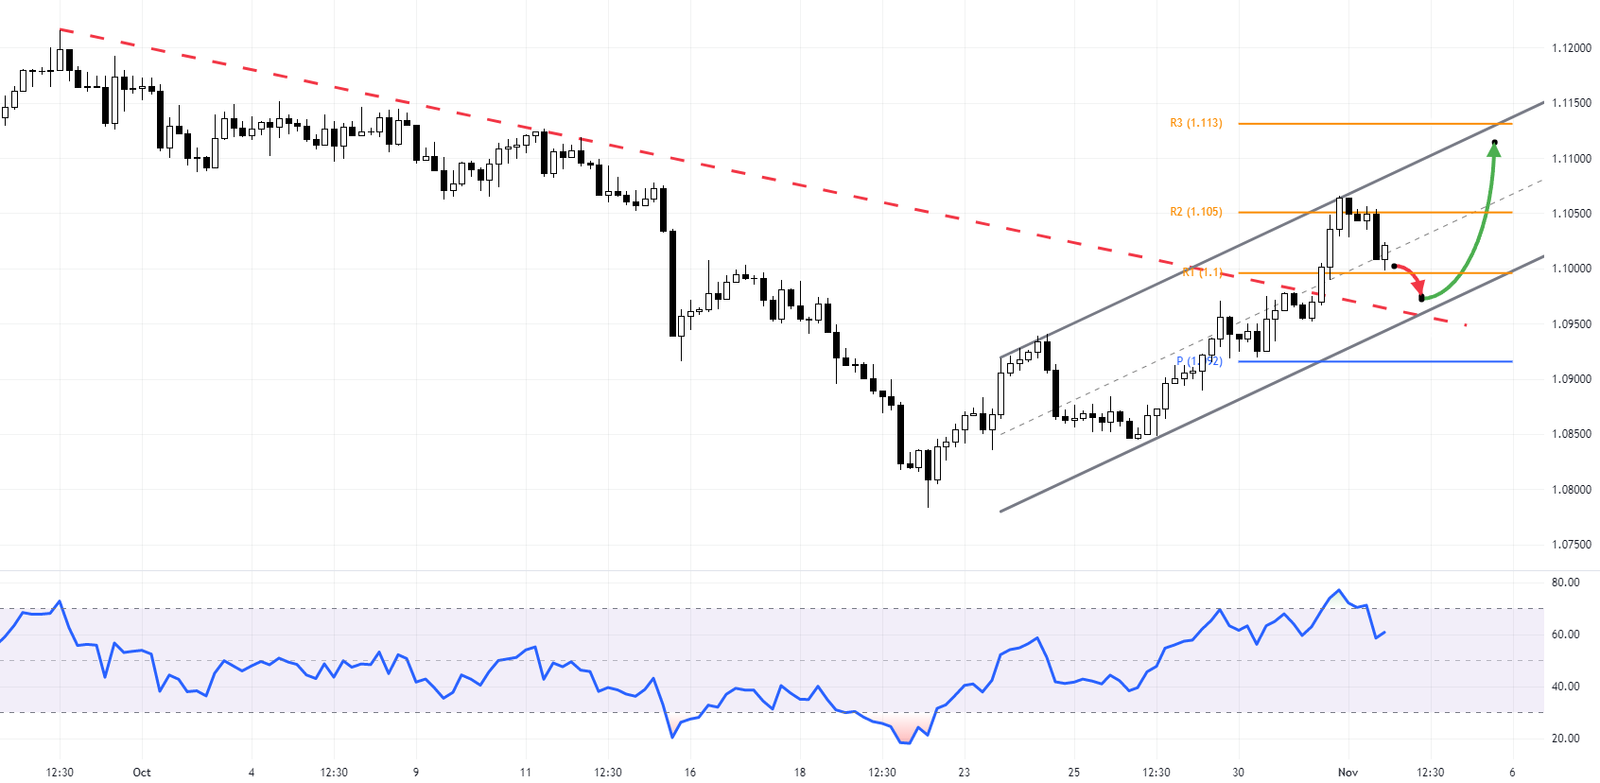
For a closer look, we turn to the 4-hour chart. The pair has moved into the overbought zone after breaking free from the bearish trendline. It’s back to testing the 1.1 support level, with the RSI indicator hovering around 60.

GBPCHF Forecast: Exploring Bullish Possibilities
On the 4-hour chart, GBPCHF is trading within a bullish channel. This suggests that bulls might target the 1.113 resistance level.
However, there’s a twist. The bearish trendline that was broken earlier is now supporting this bullish scenario. If this line is crossed again, it could signal an end to the bullish bias. In that case, we might see a continuation of the decline from the daily bearish channel towards 1.085 and possibly to 1.08.