FxMews—In today’s comprehensive GBPNZD forecast, we will scrutinize New Zealand’s current economic conditions. Then, we will meticulously delve into the details of the technical analysis of the GBPNZD pair.
A Slight Uptick in Unemployment
Bloomberg–As anticipated, New Zealand’s unemployment rate experienced a slight increase, reaching 3.9% in the September quarter of 2023. This figure marks the peak since the June quarter of 2021, edging up from the previous quarter’s 3.6%. This rise met the forecasts of economic analysts, who predicted the unemployment rate would stabilize at 3.9%.
Moreover, the underutilization rate, which gives a more comprehensive view of the unused labor potential in the economy, rose to 10.4%. This is a jump from 9.9% in the prior quarter and significantly higher than the 8.9% seen a year before.
Shifts in Workforce Engagement
Subsequently, there was a minor decrease in the labor force participation rate, which dipped to 72% from the 72.4% high reached in the preceding quarter — the highest since records began in 1986. Correspondingly, the percentage of people employed fell to 69.1% from the record high of 69.8% in the last quarter. Despite this decline, historical standards still consider the employment rate high.
GBPNZD Forecast – A Detailed Technical Analysis
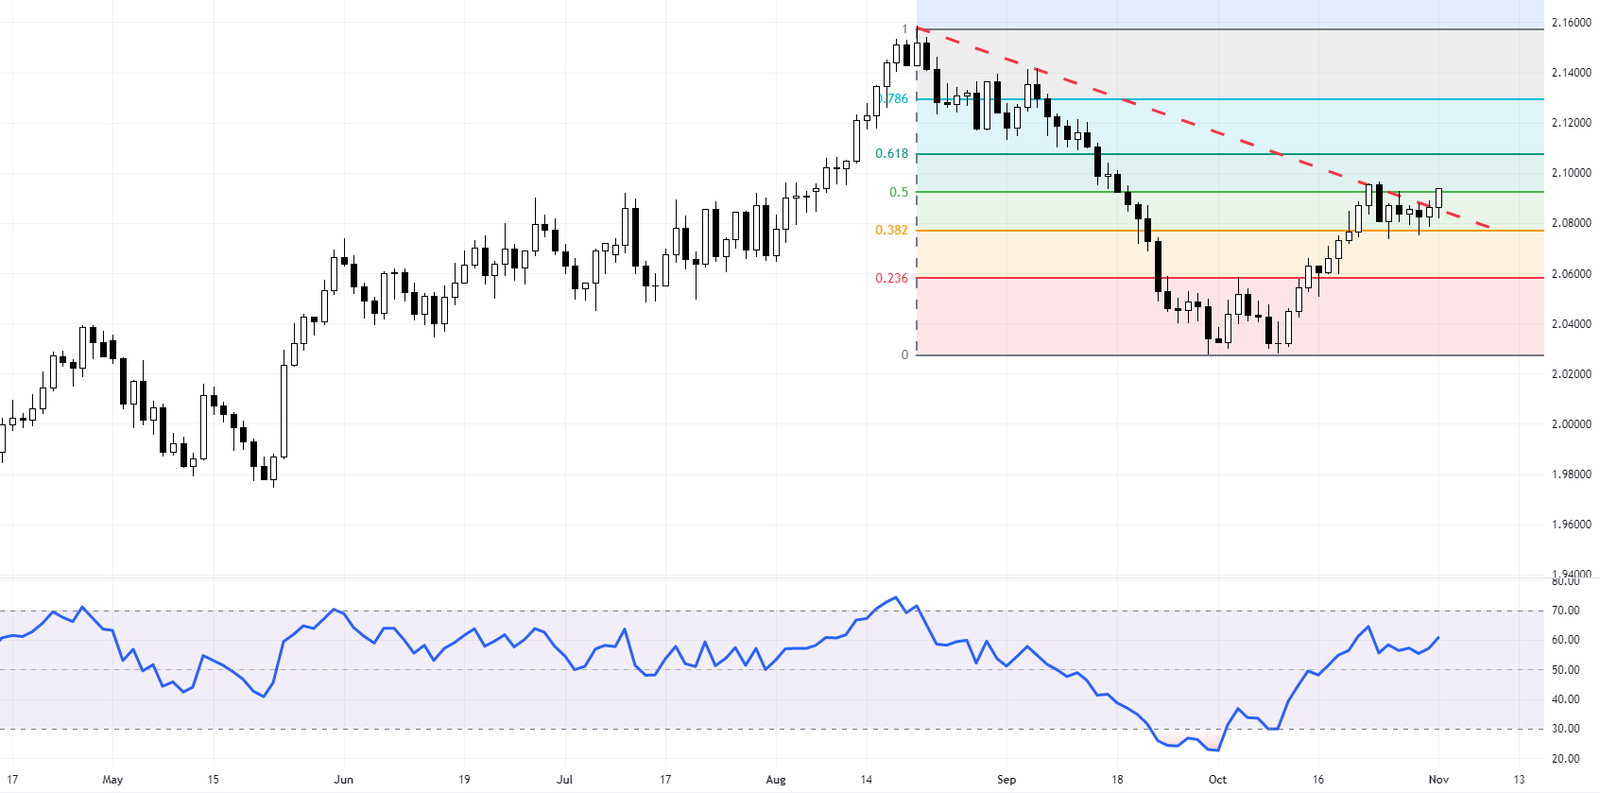
The GBPNZD currency pair has recently showcased a notable pullback from the pivotal 50% Fibonacci retracement level, only to find robust support at the 38.2% mark. This technical movement has ignited a bullish momentum, leading to a decisive breakout from the previously established bearish trendline.
The GBPNZD bulls are exerting pressure as they retest the 50% Fibonacci threshold, hinting at a potential continuation of the uptrend.

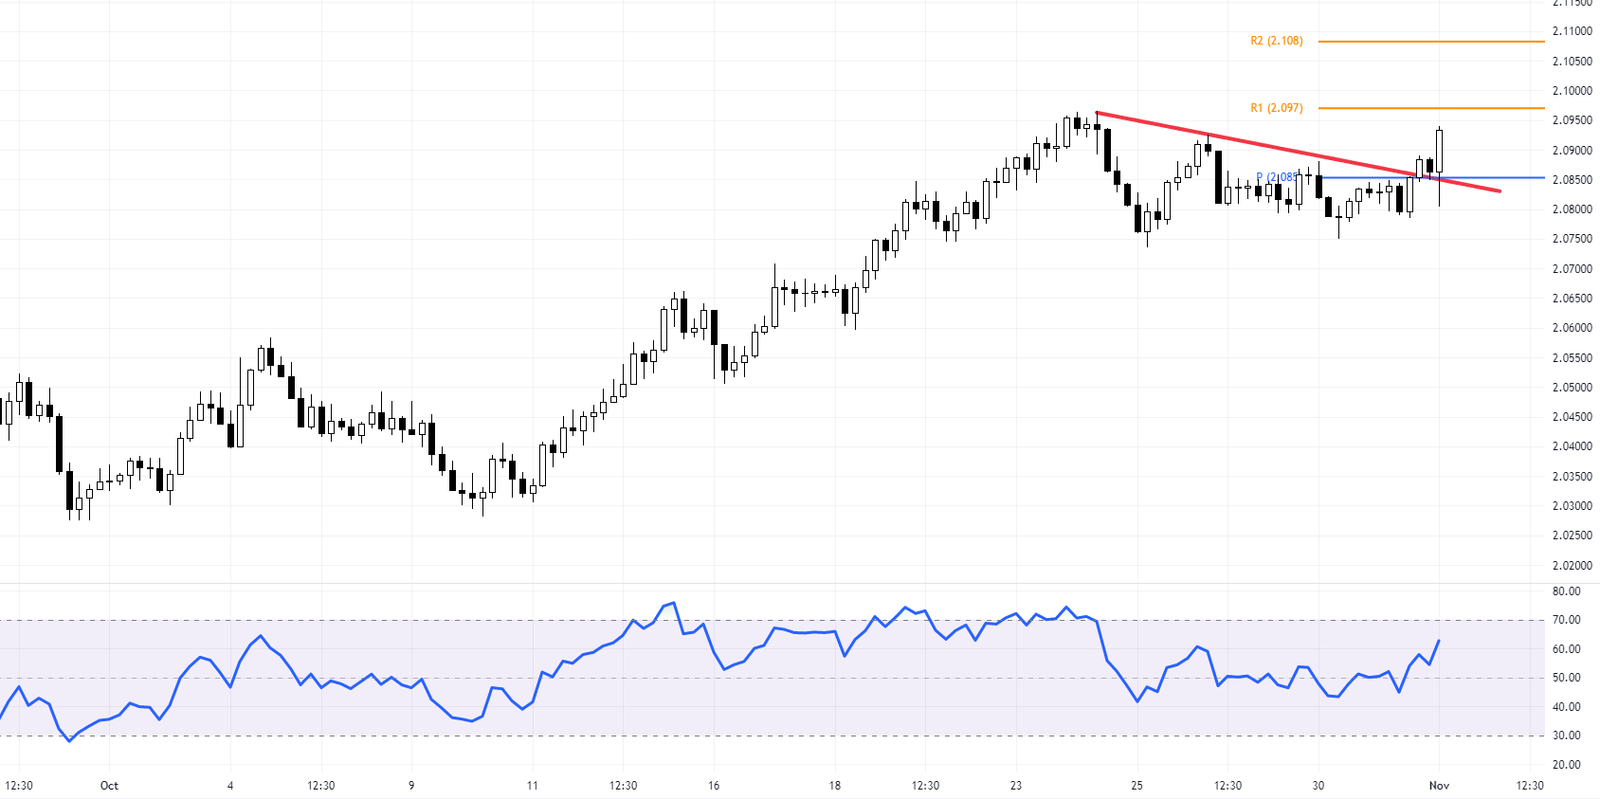
Delving deeper into the 4-hour (4H) chart provides a granular view of the GBPNZD price dynamics. The pair has successfully breached a minor bearish trendline, which proved insufficient in curbing the underlying buying strength.
The Relative Strength Index (RSI), a momentum oscillator that measures the speed and change of price movements, is trending upward. This indicator’s positive trajectory suggests that the GBPNZD pair may set its sights on the 2.108 level during this week’s trading sessions, presenting a bullish outlook for traders and investors alike.

Conversely, the 2.085 price level emerges as a critical pivot point, a foundation for the bullish narrative. Should the bears manage to push the closing price below this pivot, it would undermine the bullish forecast, signaling a potential shift in market sentiment.
For traders monitoring the GBPNZD exchange rate, it is essential to consider both the technical indicators and the broader market context. The RSI’s upward movement and the price’s interaction with key Fibonacci levels provide valuable clues about the pair’s future direction. However, as with all trading, vigilance is advised, and protective measures should be in place to manage risk, particularly if the price action invalidates the bullish scenario.