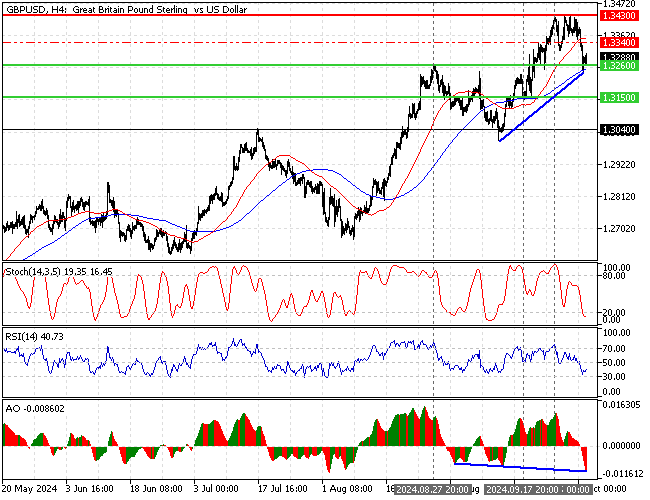
FxNews—The British currency is testing $1.326 support against the U.S. dollar, a supply zone backed by the 100-period simple moving average.

GBPUSD Technical Analysis – 2-October-2024
The recent selling pressure caused the Stochastic oscillator to enter the oversold territory, as shown in 19 in the description. This means the market is oversold, and the GBP/USD price can potentially rise and resume its uptrend.

Additionally, the Awesome oscillator indicator signals divergence, which could indicate a trend reversal or a consolidation phase on the horizon.
Overall, the technical indicators suggest the primary trend is still bullish, and the GBP/USD bull market will likely resume.
GBPUSD Forecast – 2-October-2024

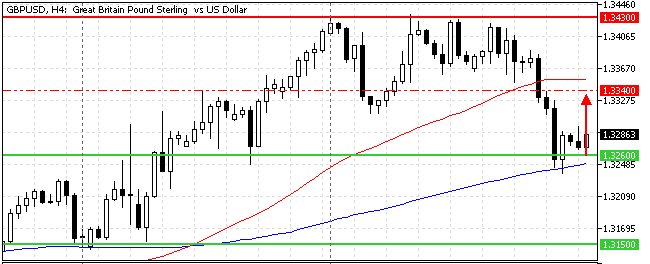
The critical resistance is at $1.326, the August 27 high. From a technical perspective, the uptrend will likely resume if the GBP/USD buyers maintain the exchange rate above this mark. If this scenario unfolds, the 50-period simple moving average could be tested as an active resistance at approximately $1.334.
Furthermore, if the buying pressure exceeds $1.334, the next bullish target could be revisiting the September 25 high at $1.343. Please note that the bullish strategy should be invalidated if the GBP/USD dips below the critical resistance of $1.326.
- Also read: EUR/USD Technical Analysis – 2-October-2024
GBPUSD Bearish Scenario – 2-October-2024

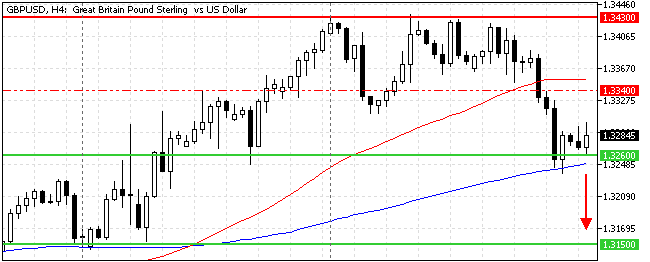
If bears (sellers) close the GBP/USD price below the $1.326 critical support, the dip from $1.343 could extend to the $1.315 resistance. In this scenario, the primary trend will be bearish because the market dips below the 100-period SMA.
GBPUSD Support and Resistance Levels – 2-October-2024
Traders and investors should closely monitor the key levels below to make informed decisions and adjust their strategies accordingly as market conditions shift.
- Support: $1.326 / $1.315 / $1.304
- Resistance: $1.334 / $1.343