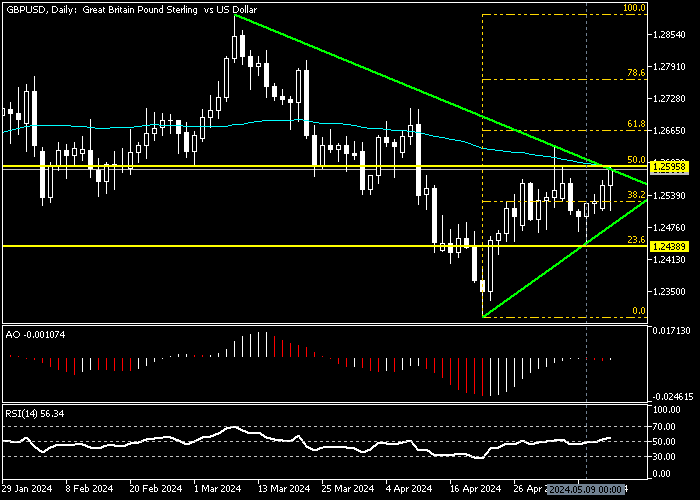
FxNews—Pound Sterling resumed its uptrend trajectory against the U.S. dollar since May 9 from the 23.6% Fibonacci retracement level, the 1.243 mark. As of writing, the GBPUSD currency pair tests the 50% Fibonacci (1.259), a level that neighbors the descending trendline.
Concurrently, the relative strength index flipped above the median line, a signal that the uptrend might continue. But the bulls must overcome the 1.259 key barrier. Hence, to find key levels and trading opportunities, we zoom into the 4-hour chart.

GBPUSD Technical Analysis – A Potential Rise to 1.26
The GBPUSD 4-hour chart below demonstrates the currency pair trades in the bullish flag, above EMA 50 and the Ichimoku cloud. The awesome oscillator and relative strength index are bullish, too.
These developments in the technical tools signal a continuation of the bull market.

From a technical standpoint, for the uptrend to resume, the pound sterling must close and stabilize itself above 1.259 against the U.S. dollar. If this scenario comes into play, the wave that started from 1.24 will likely expand to 1.266, followed by the upper band of the bullish flag.
The Bearish Scenario
On the flip side, if the buyers fail to surpass the 1.259 key resistance ceiling, the price will likely decline to 38.2% Fibonacci, followed by the lower band of the bullish flag.
Notably, if the bearish scenario comes into play and the GBP/USD price dips to the bottom of the bullish flag, this 1.25 mark offers a decent bid for the buyers to rejoin the market. Therefore, analysts at FxNews suggest meticulously monitoring the 1.250 key levels.
GBPUSD Key Support and Resistance Level
Traders and investors should closely monitor the GBP/USD key levels below to make informed decisions and adjust their strategies accordingly in market shifts.
- Resistance: 1.259, 1.266
- Support: 1.252, 1.250, 1.243