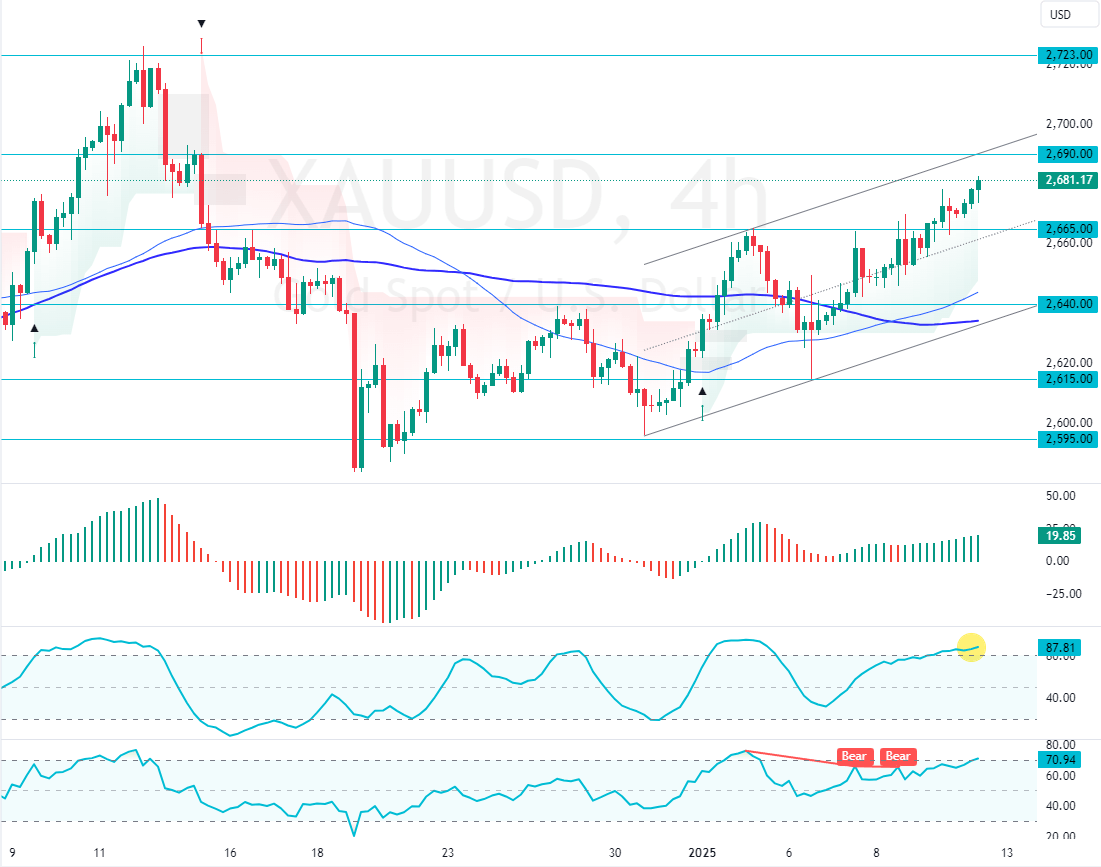
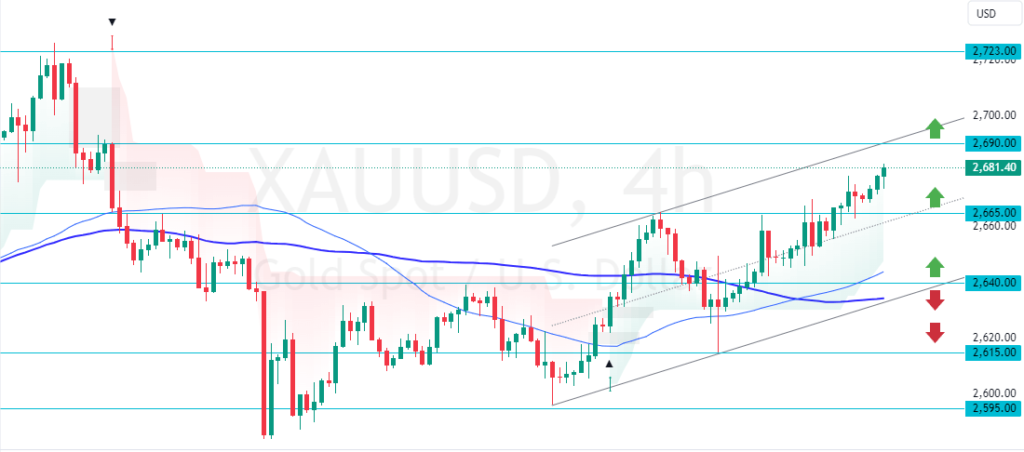
Gold exceeded $2665 resistance. However, robust buying pressure made the yellow metal overbought. Before the uptrend resumes, a consolidation phase toward $2,640 is expected.
Gold Technical Analysis – 10-January-2025
FxNews—XAU/USD has been in a bull market, above the 50—and 100-period simple moving average and has gained $3.30% since December 30, 2024. This week, the prices exceeded $2,665, escalating the uptrend. However, this bullish wave drove the momentum indicators into overbought territory.
As of this writing, the precious commodity trades at approximately $2,680, marching toward the upper line of the bullish flag.
What Do Technical Indicators Reveal?
- The RSI 14 value is 71.0, which is inside the overbought territory. This means Gold is overpriced, at least for a short while.
- The Stochastic Oscillator value is 88.0, supporting the RSI’s overbought signal.
- The Awesome Oscillator histogram is green, above zero, hinting at the strong bull market.
Overall, the technical indicators suggest that while the primary trend is BULLISH, Gold has the potential to consolidate near the lower support levels before the uptrend resumes.
Gold Exceeded $2665: What’s Next?
The market outlook remains bullish as long as XAU/USD trades above the 100-period SMA or the $2,640 support.
However, going long in a bull market that is overwhelmed with buyers is risky because the prices are too high. The Stochastic Oscillator and RSI 14 hovering in overbought territory hints at a possibility of a trend reversal or a consolidation phase.
That said, retail traders and investors should wait patiently for Gold to start and end its consolidation phase, which could cause prices to target a lower support level.
The immediate support is at $2,665. From a technical perspective, a new consolidation phase could emerge if the prices fall below $2,665. In this scenario, Gold could dip toward the $2,640 support, offering a decent bid to join the market.
The next target in the bullish strategy will likely be the $2,723 mark.
The Bearish Scenario
The $2,640 resistance divides the bull market from the bear market. From a technical standpoint, the uptrend should be invalidated if XAU/USD falls below $2,640. In this scenario, the yellow metal could fall toward the next bullish target, which could be $2,615.
Gold Support and Resistance Levels – 10-January-2025
Traders and investors should closely monitor the XAU/USD key levels below to make informed decisions and adjust their strategies accordingly as market conditions shift.
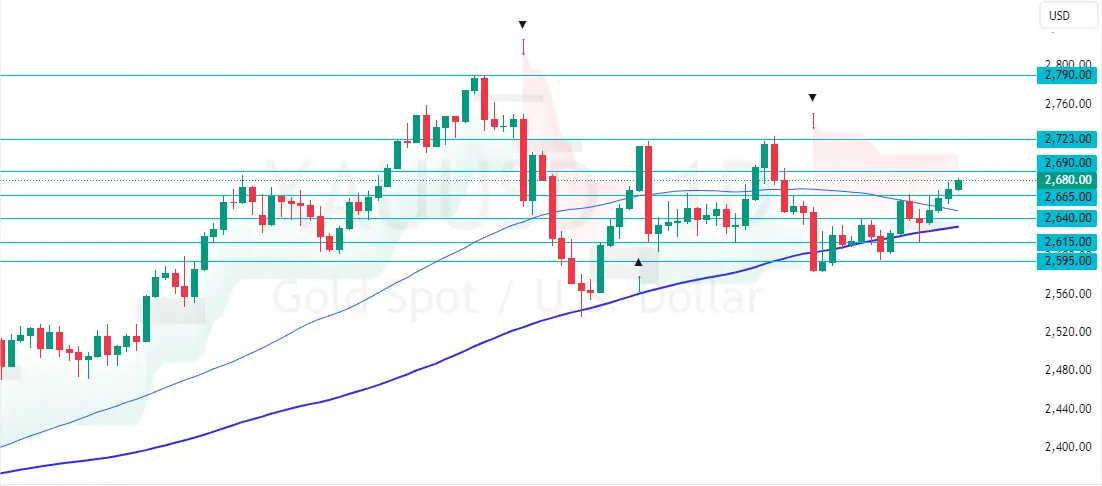
| Gold Support and Resistance Levels – 10-January-2025 | |||
|---|---|---|---|
| Support | $2,665 | $2,640 | $2,615 |
| Resistance | $2,690 | $2,723 | $2,790 |


