FxNews—XAU/USD has risen this week, reaching $1,865.35 per troy ounce. This happens because investors seek a safe place to put their money, often when the economy is uncertain or volatile. The US Dollar, on the other hand, has been weakening. T
his is partly due to comments made by officials from the Federal Reserve (Fed), the central banking system of the United States. These officials have suggested that there may not be any further tightening of monetary policy.
Fed Officials Signal Slower Rate Hikes Ahead
Two such officials, Fed Vice Chair Philip Jefferson and Dallas Fed President Lorie Logan, spoke at an event hosted by the National Association for Business Economics. They pointed out that higher Treasury yields (the return on investment for US government bonds) can tighten financial conditions. This could reduce the need for additional increases in interest rates.
Fed Official Says Current Rate May Curb Inflation
On Tuesday, another Fed official, Atlanta Federal Reserve President Raphael Bostic, added his voice to the discussion. He suggested that the current policy rate (the interest rate set by the Fed) is restrictive enough to achieve a 2% inflation target.
Inflation refers to the rate at which the general level of prices for goods and services is rising. Bostic noted that the impact of this policy is yet to be felt. He also mentioned that while inflation has improved considerably, there’s still a long way to go before reaching the target.
Middle East Tensions Push Treasury Yields Lower
In addition to these economic factors, geopolitical tensions in the Middle East have also influenced financial markets. These tensions have increased demand for government bonds, which are considered safe investments during uncertain times. This increased demand has resulted in lower yields on these bonds.
To give you some numbers, the yield on a 10-year Treasury note has dropped by 14 basis points (a basis point is one-hundredth of a percentage point) to 4.63%. Similarly, the yield on a 2-year note has fallen by 12 basis points to 4.96%.
Gold Market Analysis – Bullish or Bearish
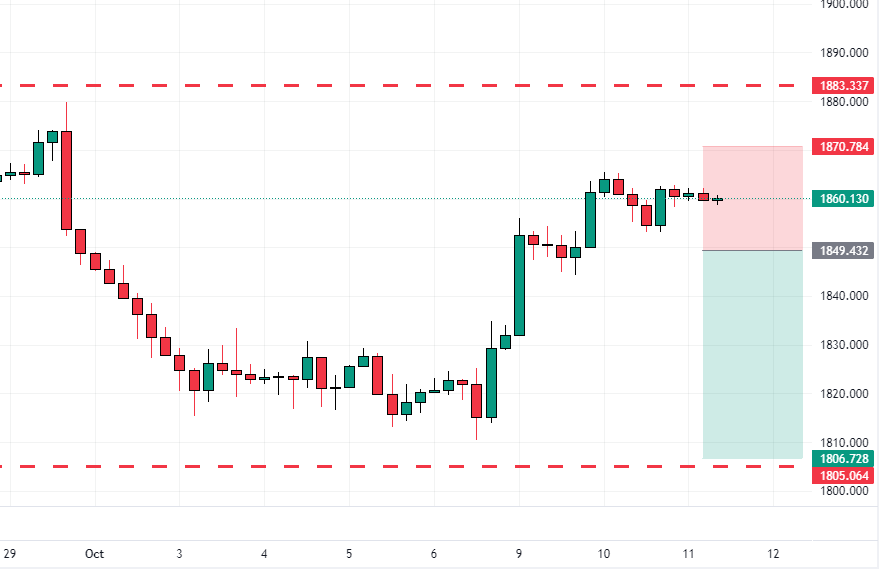
In our latest gold market analysis, we’ve observed a significant uptick in the price of gold, which has risen to $1,859. This increase was anticipated following a rebound from the support area at $1,805. Our predictions were based on several key indicators.
The RSI (Relative Strength Index) indicator was in the oversold zone, aligning with the stochastic indicator. This alignment suggested a potential rise in the XAUUSD, as we previously mentioned in our gold market analysis.
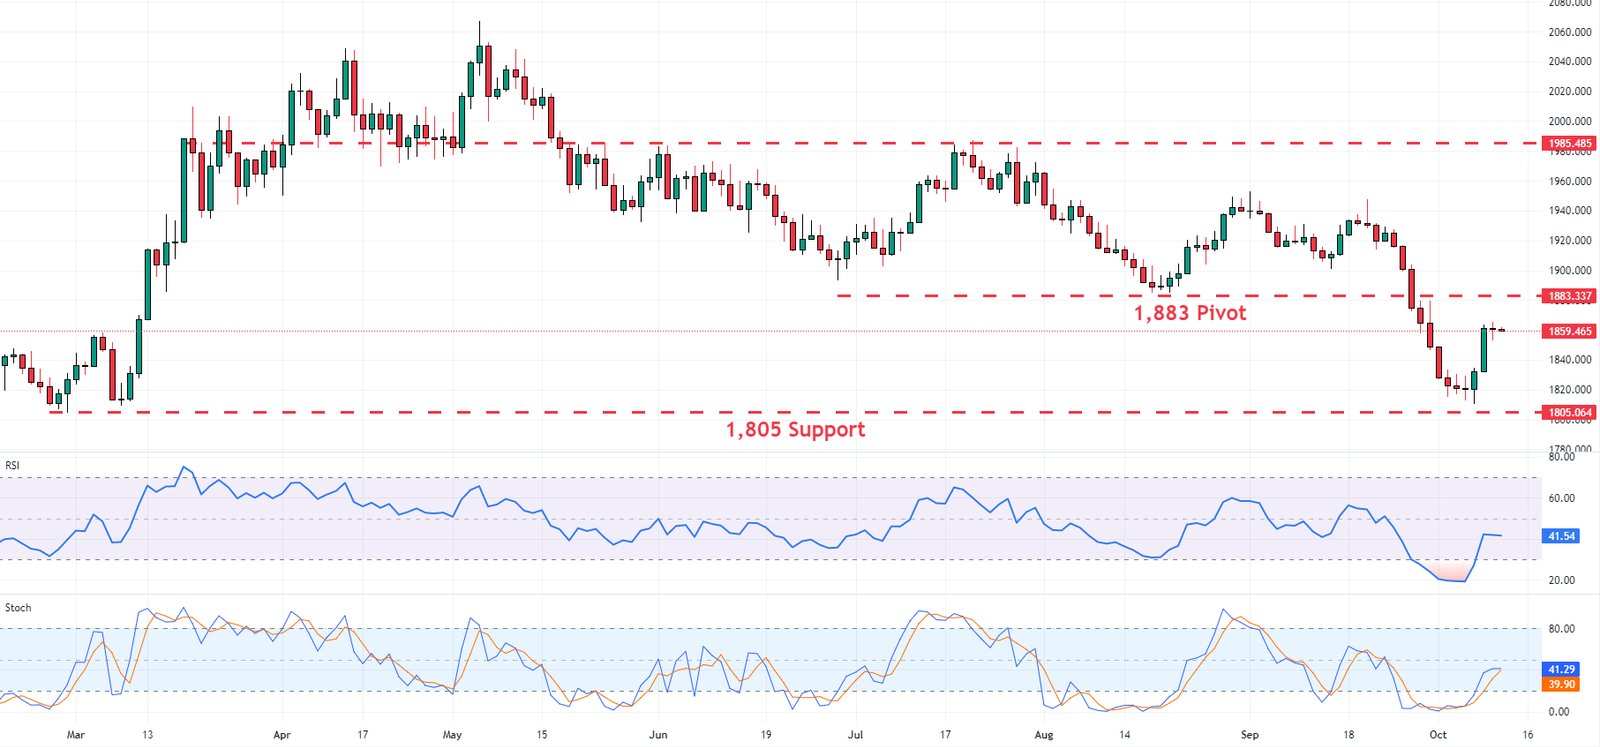
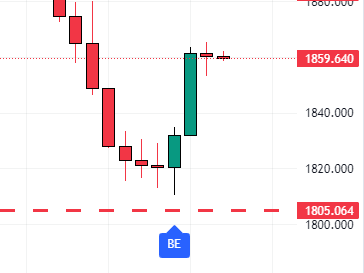
Looking at the gold daily chart, we noticed a bullish engulfing candlestick pattern forming near the $1,805 support. This pattern often signals a market reversal or a correction to recent bearish momentum, indicating a potential rise in gold prices.
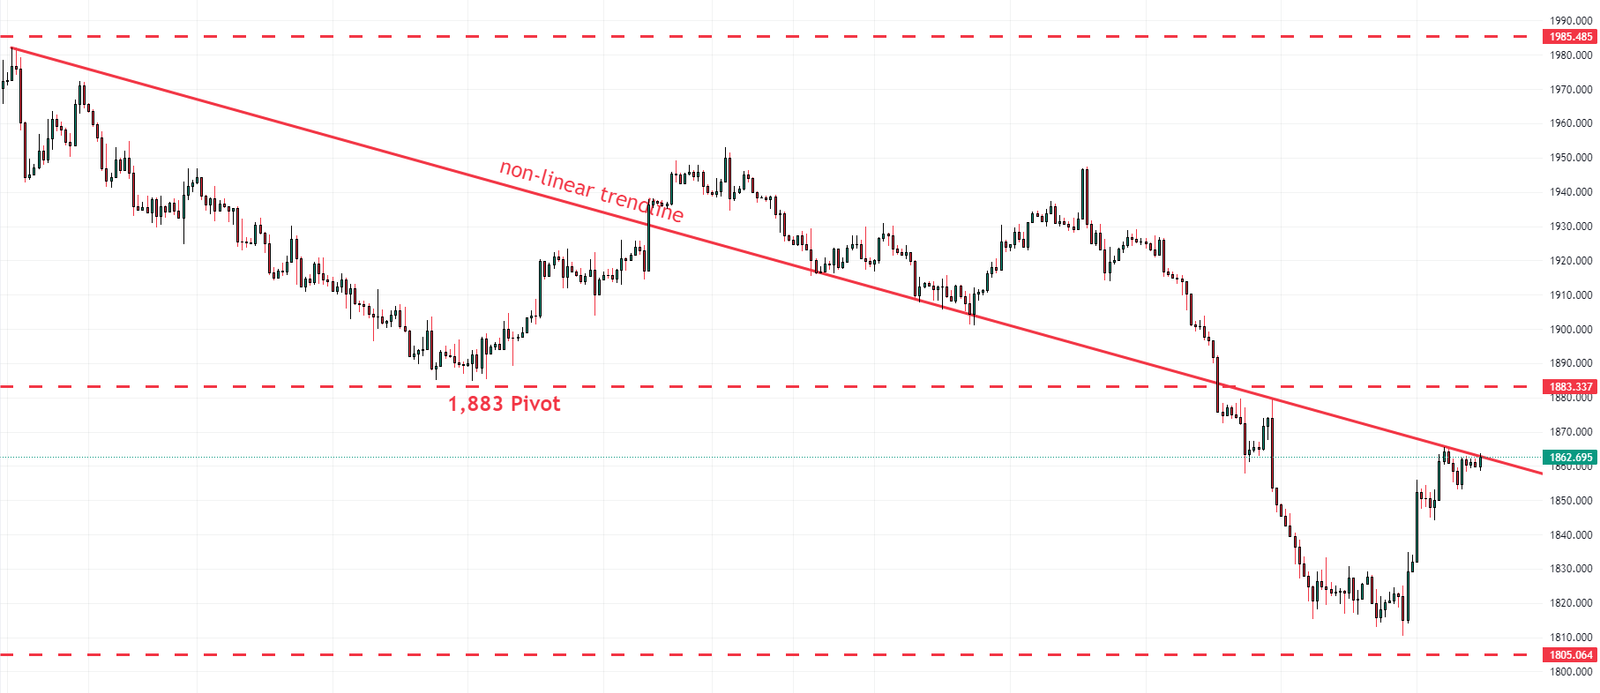
To get a more detailed view of the gold market, we zoomed into the 4H chart. We found that the gold price is currently grappling with a non-linear trendline. Concurrently, the RSI is hovering near level 70, close to the overbought zone.
- Next read: EURUSD Market Analysis – Bullish vs Bearish
However, every analysis has two sides—prices can go up or down. Our gold market analysis suggests that the bearish scenario might be stronger in this case. Bulls face a significant barrier at the $1,883 pivot point. If prices rise above this point, the RSI will likely enter the overbought zone on the 4H chart, making a bearish scenario more plausible.
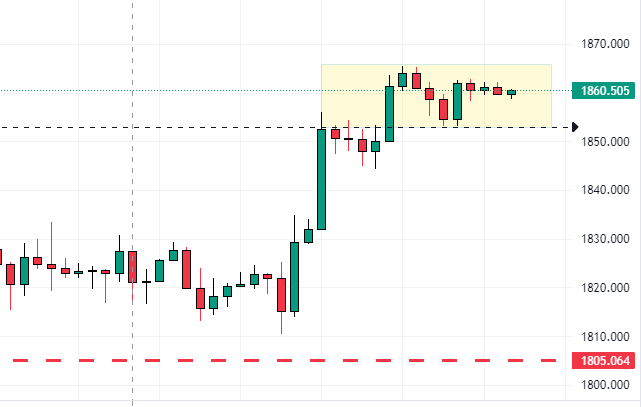
Our gold market analysis suggests a sell stop at 1,849, targeting 1,806, with risk at 1,870. This trade’s risk/reward ratio is 1/2, which is ideal.
Remember that while our analysis is based on careful study and understanding of market trends and indicators, it’s always important to research and consider multiple factors before making trading decisions.