FxNews—Gold closed the week at $2,419 against the U.S. Dollar, which is aligned with the XAUUSD all-time high of $2,430.
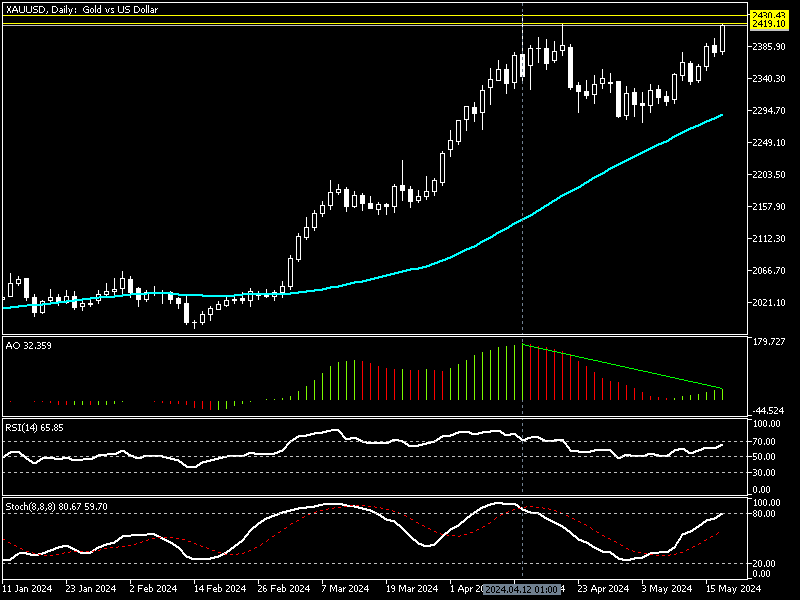
XAUUSD Technical Analysis – Daily Chart

As the gold price surges, the awesome oscillator shows a divergence in its histogram. This can be interpreted as gold might step into a consolidation phase, or the trend would reverse from uptrend to downtrend, at least for a short term.
The RSI indicator shows 65 in the description, approaching the overbought area, and concurrently, the stochastic oscillator value is 80, clinging to the overbought zone.
These developments in the technical indicators in the XAU/USD daily chart suggest a cautious approach to the bull market because the price might decline from the $2,430 resistance.
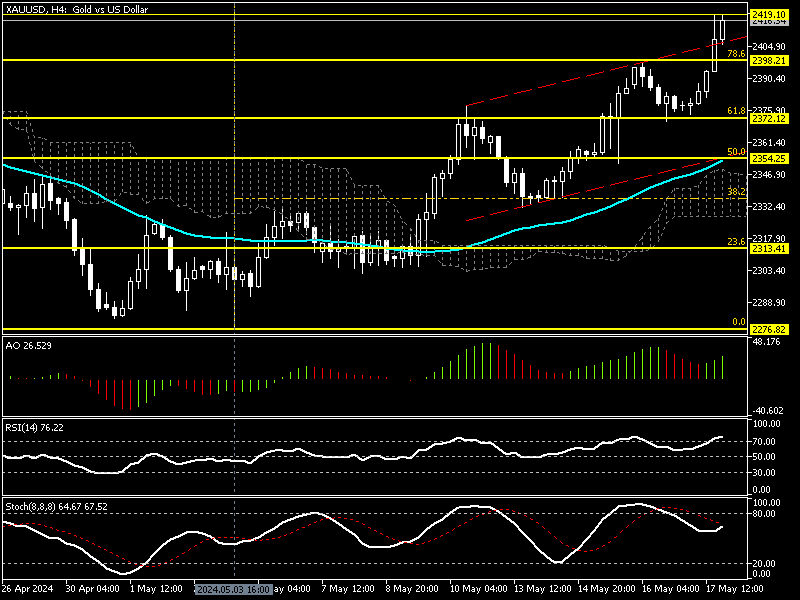
XAUUSD Technical Analysis – 4-Hour Chart

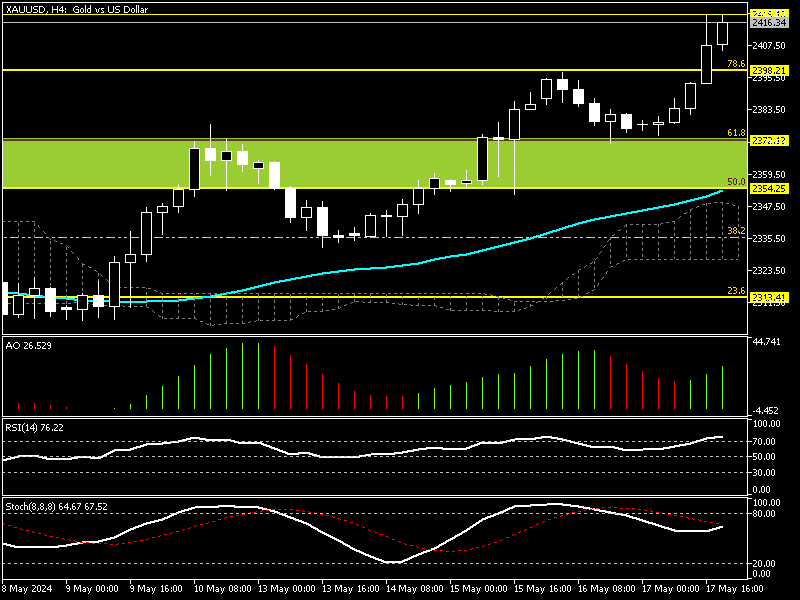
Gold broke out from the bullish channel in the 4-hour Chart, driving the relative strength index into the overbought zone. The awesome oscillator demonstrates a mild divergence, but the green bars show the yellow metal’s robust bullish momentum.
Gold Overbought – FxNews Recommend Patience

From a technical standpoint, the gold market seems saturated from buying pressure, trading close to its all-time high, the $2,430 resistance. Joining the uptrend when a trading asset is overbought is not wise; therefore, analysts at Fxnews suggest waiting patiently for the U.S. Dollar to clear some of its loss.
If the awesome oscillator’s divergence and the RSI overbought signal can influence the market, the Gold price will likely decline. In this scenario, the exchange rate might revisit the $2,372, followed by the %50 Fibonacci resistance level, the $2,354 mark. These supply zones offer a decent bid to join the uptrend gradually.
The Bearish Scenario
It is worth mentioning that EMA 50 has a pivotal role in the bull and bear markets. If the gold price flips below EMA 50, aligning with the %50 Fibonacci ($2,354), the decline could extend to $2,313, followed by the May 3 low ($2,276 mark).