Gold prices stayed around $2,670 per ounce on Wednesday. The prices are stable as traders wait for more information to understand the future actions of the U.S. Federal Reserve regarding interest rates.
Gold Up Amid Falling Dollar and Bond Yields
Gold increased in value on Tuesday. This rise happened because the U.S. dollar and government bond interest rates dropped slightly. The drop came after a report showed that U.S. manufacturing is doing worse than expected.
The NY Empire State Manufacturing Index, which measures business conditions in New York, fell to its lowest in five months in October. This indicates that business activities have shrunk after expanding in September.
Middle East Tensions May Boost Gold Prices
Investors are now looking forward to new data about U.S. shopping trends on Thursday and a speech by Fed Governor Waller on Friday. These events might provide more clues about the Federal Reserve’s economic plans.
Currently, most investors believe there’s almost a 98% chance that the Federal Reserve will reduce interest rates by 0.25% in November. Additionally, ongoing tensions in the Middle East could continue to push gold prices higher.
Gold Technical Analysis – 16-October-2024

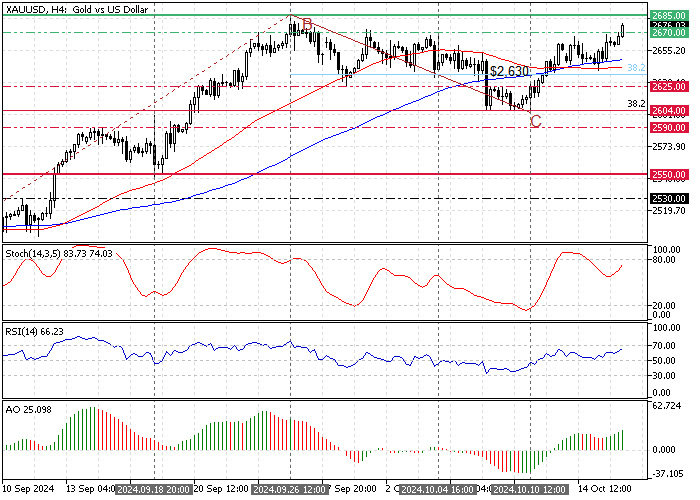
FxNews—Gold trades bullish above the 50- and 100-period simple moving averages, approaching the September 2024 high of $2,685.
As for the technical indicators, the Awesome Oscillator histogram is green and above the signal line, indicating the bull market prevails. Additionally, the Relative Strength Index indicator is above the median line, meaning the uptrend will likely resume.
Overall, the technical indicators suggest the primary trend is bullish, and the Gold price will likely extend further.
- Next read: Silver Hits $31.8 as China Boosts Banks
Gold Price Forecast – 14-October-2024
The immediate resistance rests at the September 2024 high, the $2,685 mark. From a technical perspective, the bulls’ path to the $2,700 will likely be paved if the XAU/USD rate exceeds $2,685.
Please note that the bullish strategy should be invalidated if Gold dips below the BC wave’s 38.2% Fibonacci retracement level, the $2,630 mark.