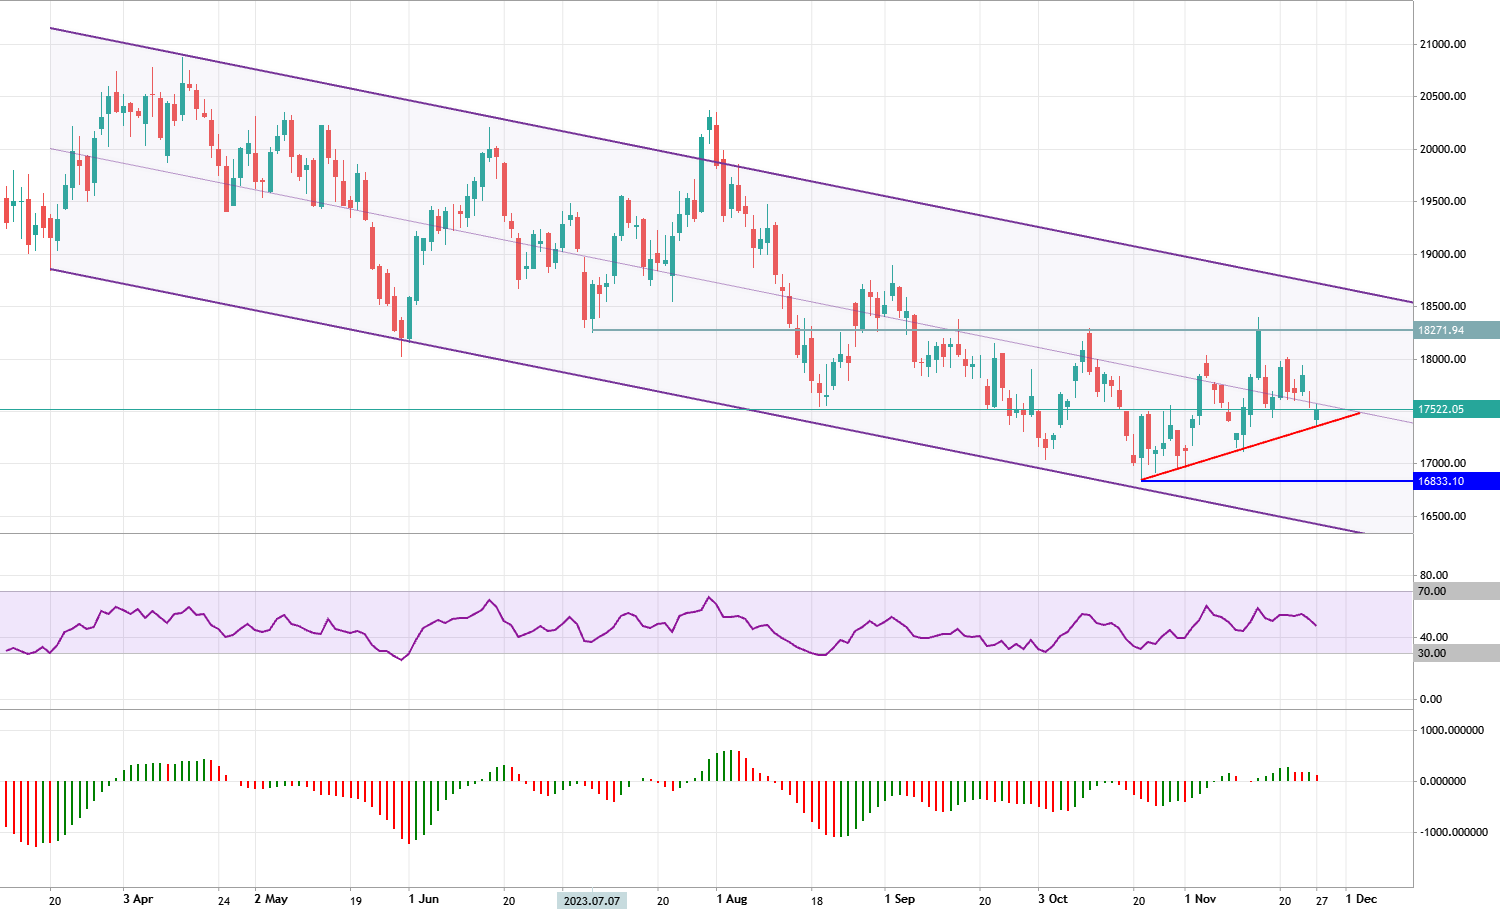
Bloomberg—On Monday, the HK50 (Hang Seng) Index concluded the trading day with a modest downturn, shedding 34.36 points, or 0.2%, to close at 17,525.06. This marked the second consecutive session of decline, largely fueled by worries about China’s uncertain economic revival.
Recent statistics revealed a slower growth in Chinese industrial profits. In the last month, they rose just 2.7% year-over-year, a significant decrease from the 11.9% surge seen in September. Looking at the broader picture, industrial profits dipped by 7.8% in the year’s first ten months, the most lenient fall since December 2022.
Financial Dynamics and Market Responses
In the local context, there were indications of tightening liquidity towards the year’s end, highlighted by a spike in the one-month interbank offered rate to its highest point since 2007. Meanwhile, futures traded slightly lower in the United States despite a record-breaking surge in online spending during Black Friday.
Nevertheless, the Hang Seng Index pared some of its earlier losses. This was partially driven by investors’ growing optimism that China’s property market downturn might be close to its end, thanks to various support measures from the Chinese government.
Longfor Group experienced a sharp drop of 4.2% in individual stocks. Declines followed in other notable companies, such as Sinopharm Group Co. (down 3.0%), Li Ning (down 2.9%), Yadea Group (down 2.2%), and Fosun International (down 1.5%).
HK50 Analysis – Modest Decline in the Index
The HK50 index is currently exhibiting a bearish trend within its trading channel, as indicated by the Relative Strength Index (RSI) and the Awesome Oscillator. Despite these bearish signals, the HK50 stays above a bullish trend line marked in red. The index must close below this trend line for the bearish trend to persist. Should this occur, the next bearish target is projected to be in the region of 16,823.

Conversely, as long as the index maintains its position above this critical line, there is potential for an upward correction. The HK50 might approach the resistance level at $18,271 in such a scenario. This dichotomy underscores the current volatility and the balance of bearish and bullish forces influencing the index’s movement.