As Hurricane Rafael, now a Category 1 storm with 90 mph winds, heads toward Cuba, natural gas futures in the U.S. have climbed to nearly $2.7 per MMBtu. Oil and gas producers in the Gulf of Mexico are halting operations in anticipation of the storm, which may gain strength before landfall.
In the coming weeks, cooler conditions are forecasted later in the month despite the expectation of warmer-than-average temperatures through mid-November. Concurrently, U.S. LNG exports have decreased this month, mainly because the Freeport LNG facility is temporarily offline.
Natural Gas Prices Stay Low Despite New Projects
On the production front, a boost is anticipated by late 2024 and into 2025, fueled by new projects like Venture Global’s Plaquemines plant and Cheniere Energy’s expansion in Texas. However, despite these developments, natural gas prices are still more than 10% below October’s high of $3.1 per MMBtu, attributed to the subdued heating demand and ample supplies.
NATGAS Analysis – 6-November-2024

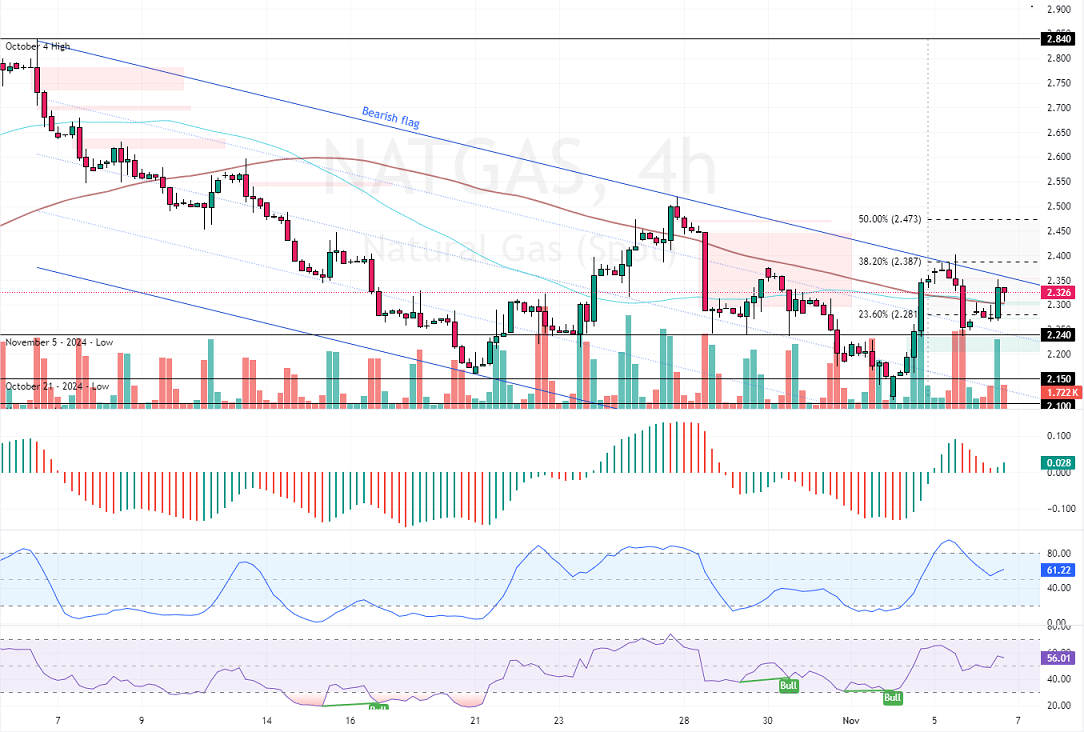
The NATGAS primary trend should be considered bearish despite the price being slightly above the 100-period simple moving average. This is because the U.S. natural gas trades inside the bearish flag in the 4-hour chart.
As for the technical indicators, we note that the Awesome Oscillator histogram is green and above the signal line, indicating a bullish market. However, for the uptrend to resume, buyers must close and stabilize the price above the 38.2% Fibonacci retracement level at $2.38. If this scenario unfolds, the next bullish target could be the 50% Fibonacci retracement level at $2.47.
Please note that the bullish scenario should be invalidated if NATGAS dips below the 23.6% Fibonacci.
NATGAS Bearish Scenario

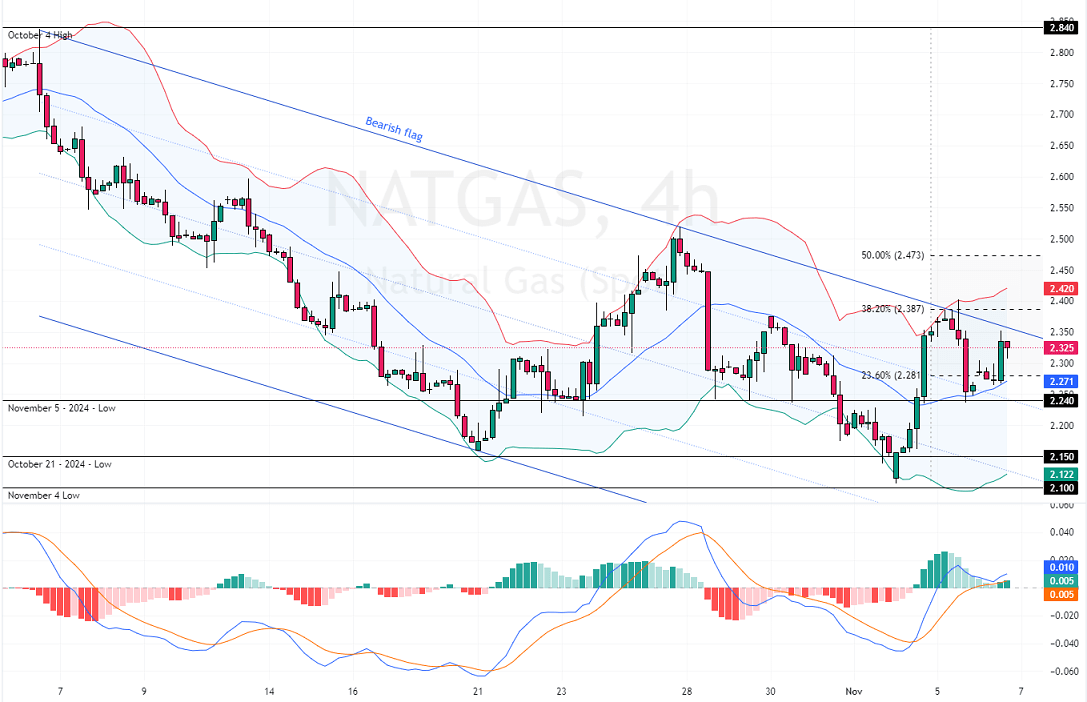
Conversely, the immediate support rests at the 23.6% Fibonacci retracement level at $2.81, backed by the middle line of the Bollinger Bands. A new bearish wave would emerge if the U.S. natural gas price falls below the 2.28 mark. If this scenario unfolds, the next bearish target could be the November 5 low at $2.24.
Furthermore, if the selling pressure pushes the prices below $2.24, the next bearish target could be the October 21 low at $2.15.