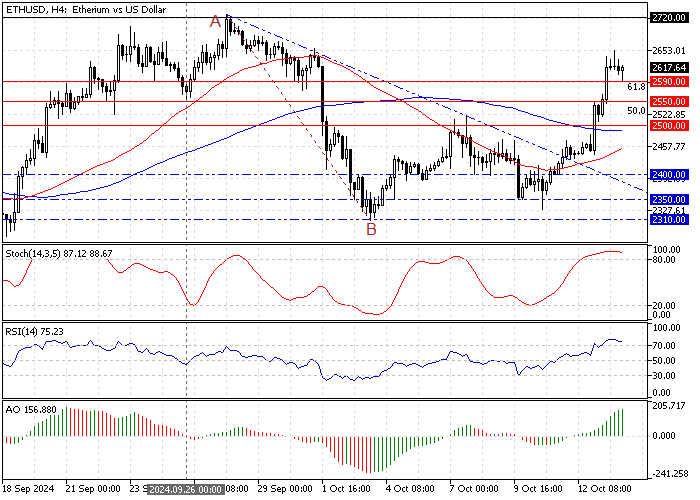
FxNews—Ethereum price trades bullish at approximately $2,610. Today, the bears tested the $2,590 resistance. Consequently, the price bounced, and the uptrend resumed.
The 4-hour chart below demonstrates the price, support, resistance levels, and technical indicators utilized in today’s analysis.

Ethereum Technical Analysis – 15-October-2024
However, the Stochastic and RSI 14 are overbought territory, signaling that Ethereum is overpriced in the short term. On the other hand, the Awesome Oscillator histogram is green, above the signal line, meaning the primary trend is bullish.
Overall, the technical indicators suggest the primary trend is bullish, but Ethereum is overbought, and the price could dip or consolidate.
- Also read: Election Patterns and Bitcoin’s Next Move
Ethereum Price Forecast – 15-October-2024

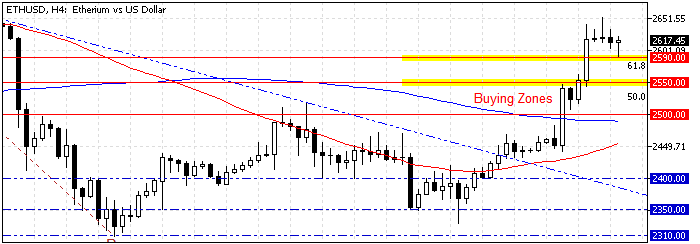
The September 24 low at $2,590 is immediate support. From a technical perspective, a consolidation phase could be initiated if sellers push ETH/USD below the $2,590 mark. In this scenario, the consolidation phase could extend to the September 26 low, the $2,550 mark.
Please be aware that it is not advisable to join a bull market when it is saturated from buying pressure. Hence, analysts at FxNews suggest retail traders and investors wait patiently for the Ethereum price to consolidate near the lower support levels before going long on this cryptocurrency.
It is worth noting that Ethereum’s next bullish target will likely be the September 2024 high, the $2,720 mark.
- Next Read: Solana Bounces to $141 – Bulls Eyeing $149
Ethereum Support and Resistance Levels – 15-October-2024
Traders and investors should closely monitor the key levels below to make informed decisions and adjust their strategies accordingly as market conditions shift.
- Support: $2,590 / $2,550 / $2,500
- Resistance: $2,720 /