FxNews—Solana‘s price dipped from $183.3 in today’s trading session, a decline promised by the overbought Stochastic and the Awesome Oscillator divergence signal.
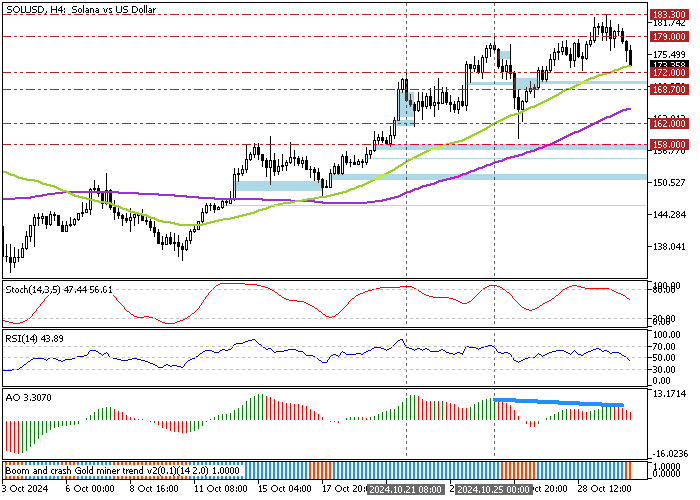
As of this writing, the SOL/USD cryptocurrency pair tested the 50-period simple moving average as support at approximately $172.0. The 4-hour price chart below demonstrates the price, support, and resistance levels and technical indicators utilized in today’s analysis.

Solana Bull Market Weaken as Bear Signals Strengthen
The price is above the 50- and 100-period simple moving average, making the primary trend bullish. But RSI 14 flipped below the median line, signaling that the bear market is strengthening. Furthermore, the Stochastic Oscillator declined, depicting 57 in the description, backing the RSI 14 signal on the bearish momentum.

Furthermore, the Awesome Oscillator histogram is red, declining toward the signal line from above, which is interpreted as the bull market weakening.
Overall, the technical indicators suggest the primary trend is bullish, but SOL/USD has the potential to dip and test the lower support levels.
Solana Could Slide to $162 if $172 Support Breaks

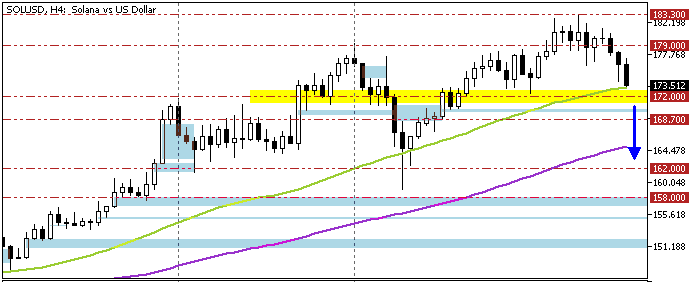
The immediate support is at $172.0, the October 21 high. From a technical perspective, the current bearish wave can potentially extend to the $162.0 mark (October 26 Low) if bears push the price below the immediate support.
The Bullish Scenario

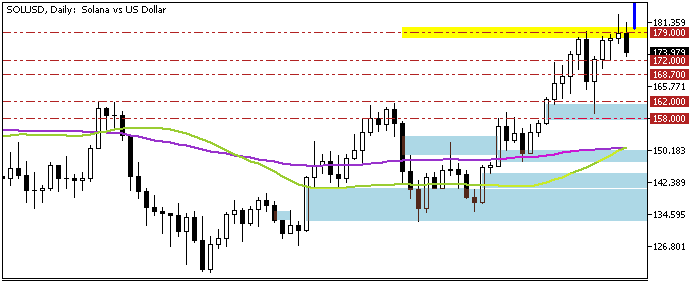
The primary bullish trend will likely resume if bulls pull SOL/USD above the $179.0 resistance (October 25 High). If this scenario unfolds, Solana’s path to the July 2024 all-time high at 194.0 could be paved.
Key Support and Resistance Levels
Traders and investors should closely monitor the key levels below to make informed decisions and adjust their strategies accordingly as market conditions shift.
- Support: 172.0 / 168.7 / 162.0
- Resistance: 179.0 / 183.0 / 194.0

J.J Edwards is a finance expert with 15+ years in forex, hedge funds, trading systems, and market analysis.