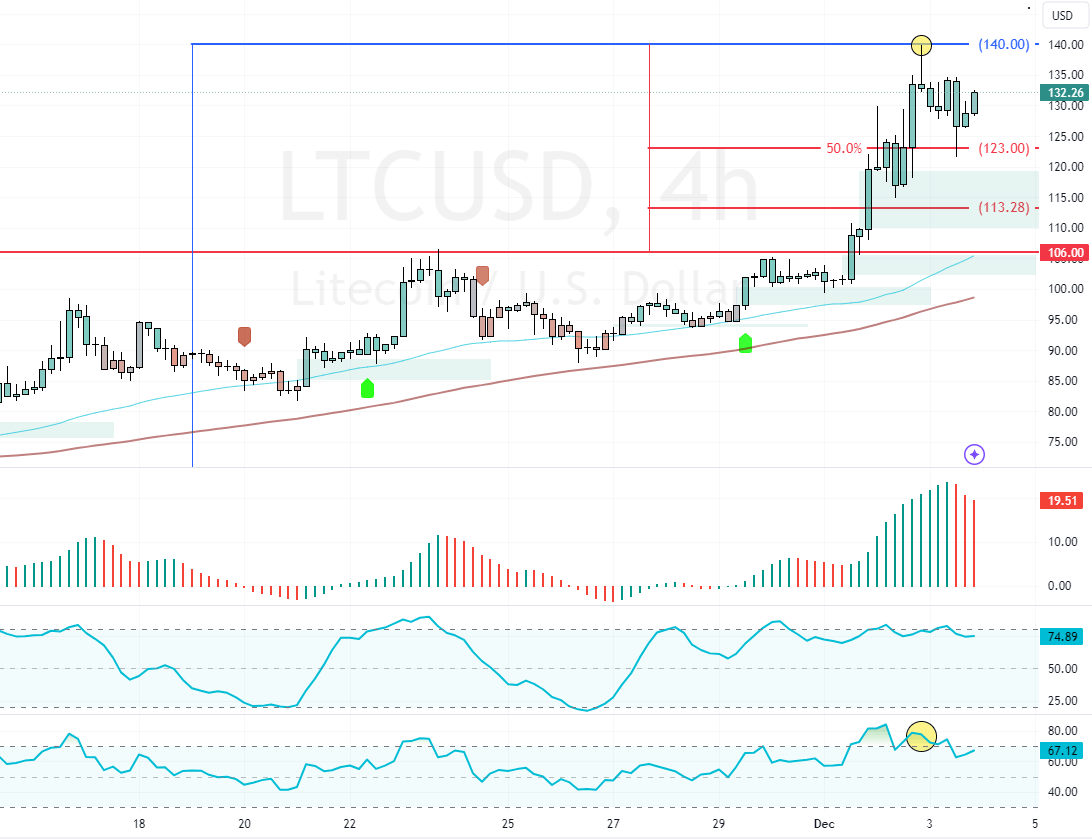
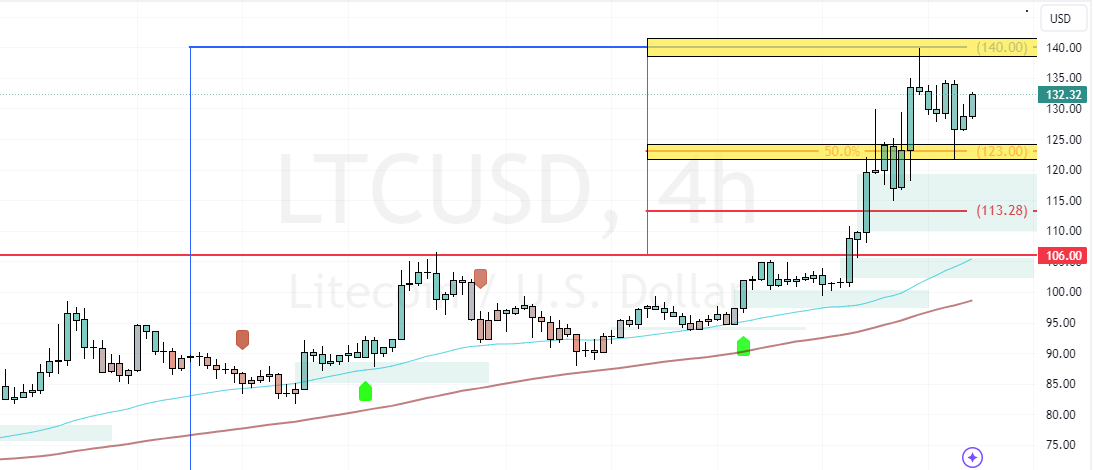
FxNews—Litecoin‘s value declined from $140.0 as anticipated amid overbought signals and the long upper shadow candlestick pattern. As of this writing, LTC/USD trades at approximately $131, which bounced off the 50.0% Fibonacci support level.

Technical Analysis
As for the technical indicators, the Awesome Oscillator bars are above the signal line but in red and decreasing. This means the bull market weakened. Additionally, the relative strength index stepped down from the overbought territory, depicting 66 in the description.
Despite the bearish signals given by the momentum indicators, Litcoin prices are above the 50- and 100-period simple moving average, bullish the primary trend.
Overall, the technical indicators suggest that while the cryptocurrency is in a bull market, the consolidation phase could either extend to a lower support level or initiate sideways momentum.
Litecoin is Bullish Above $106

The main support for the bull market is at $106. Therefore, Litecoin’s main trend should be considered bullish as long as the price is above this support.
That said, the uptrend will likely be triggered if LTC/USD closes and stabilizes above the 140.0 mark. In this scenario, the next bullish target could be $150.0.
Bearish Scenario
Conversely, a new bearish wave could be triggered if bears (sellers) push Litecoin below the immediate support at $1230. If this scenario unfolds, the consolidation phase could extend to $113.0, followed by $106.0.
Please note that the $113.0 and $106.0 mark provide a decent bid price to join Litecoin’s bull market.