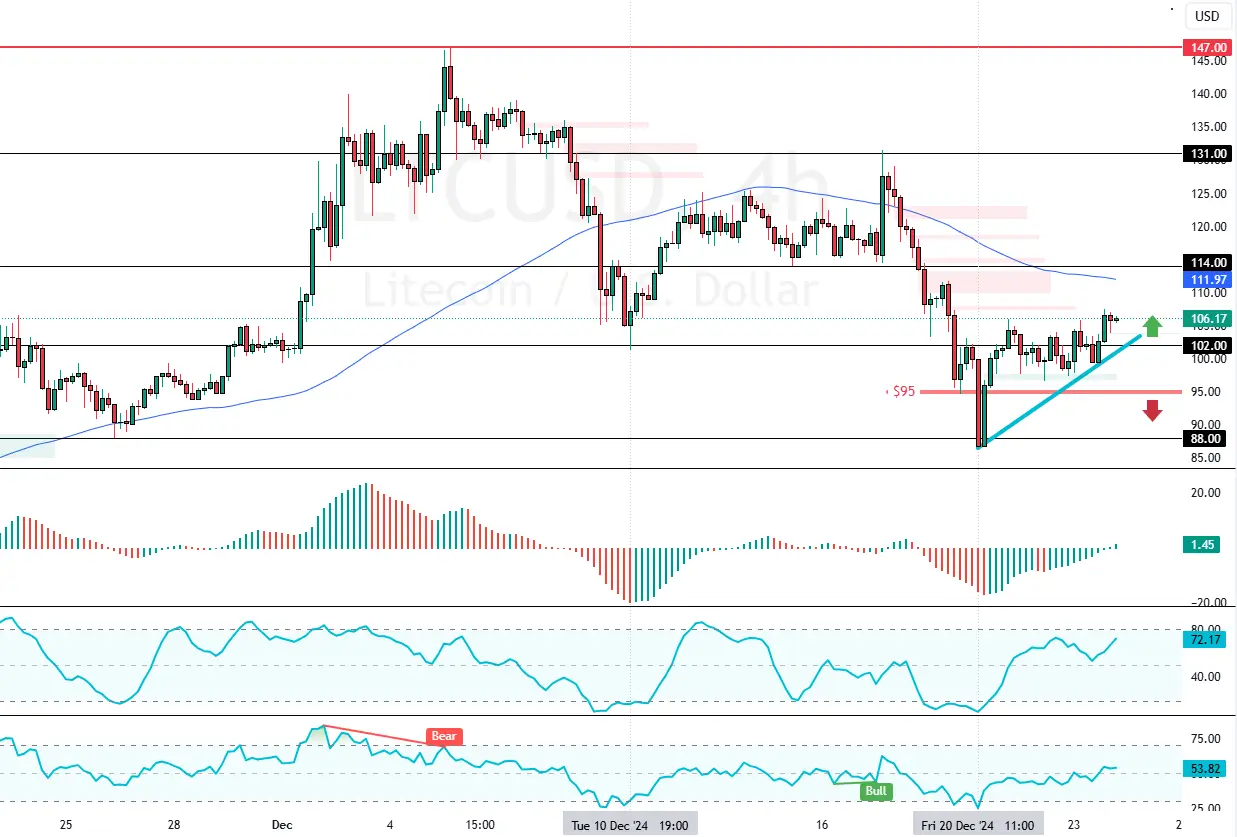
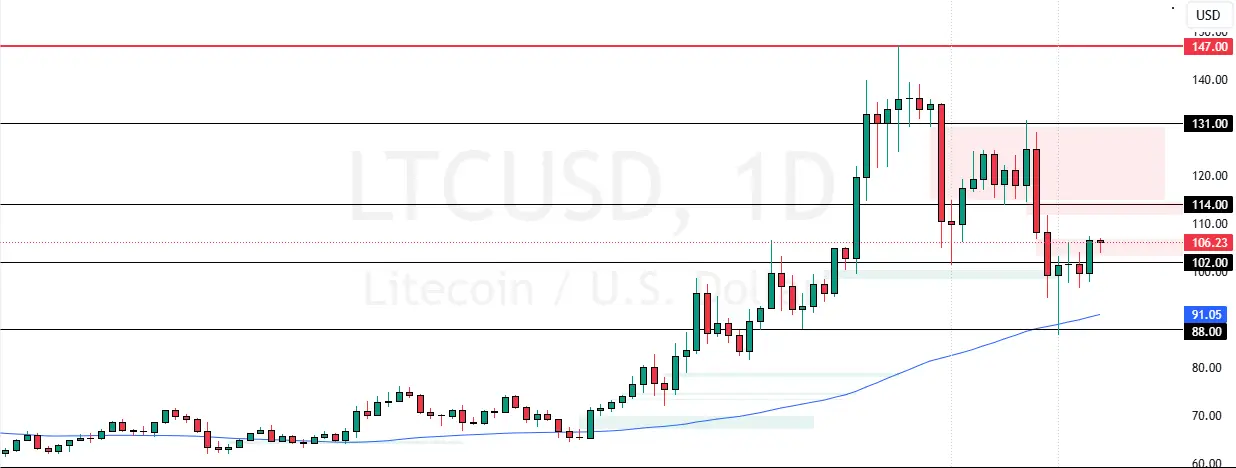
LTC/USD began consolidating from $88.0, trading at about $106.0. If the critical support level of $95.0 holds firm, Litecoin could target $114.0, a resistance level backed by 75-period SMA.

Litecoin Technical Analysis – 24-December-2024
As of this writing, Litecoin trades at approximately $106.0, resuming its consolidation phase from $88.0 on Friday, December 20. During the weekend, the cryptocurrency pair erased %23.0 of its recent losses, stabilizing above the $100.0 physiological level.
As for the technical indicators, the Awesome Oscillator histogram is green and shifted above zero, meaning a new bull market could be on the horizon. Furthermore, the RSI and Stochastic show signs of a bull market by depicting 53 and 72 in the description.
Overall, the technical indicators suggest while the primary trend is bearish, the current uptick in momentum could rise toward a higher resistance area.
Litecoin Could Target $114: Bull Market Hinges at $95.0

The immediate support is at $95.0. From a technical perspective, Litecoin could target $114, testing the 75-period simple moving average as resistance. However, for this scenario to unfold, LTC/USD should maintain its value above the $95.0 support.
The Bearish Scenario
Please note that the bullish outlook should be invalidated if LTC/USD dips below $95.0. In this scenario, a new bearish wave will likely emerge, which could drag the prices toward $88.0.