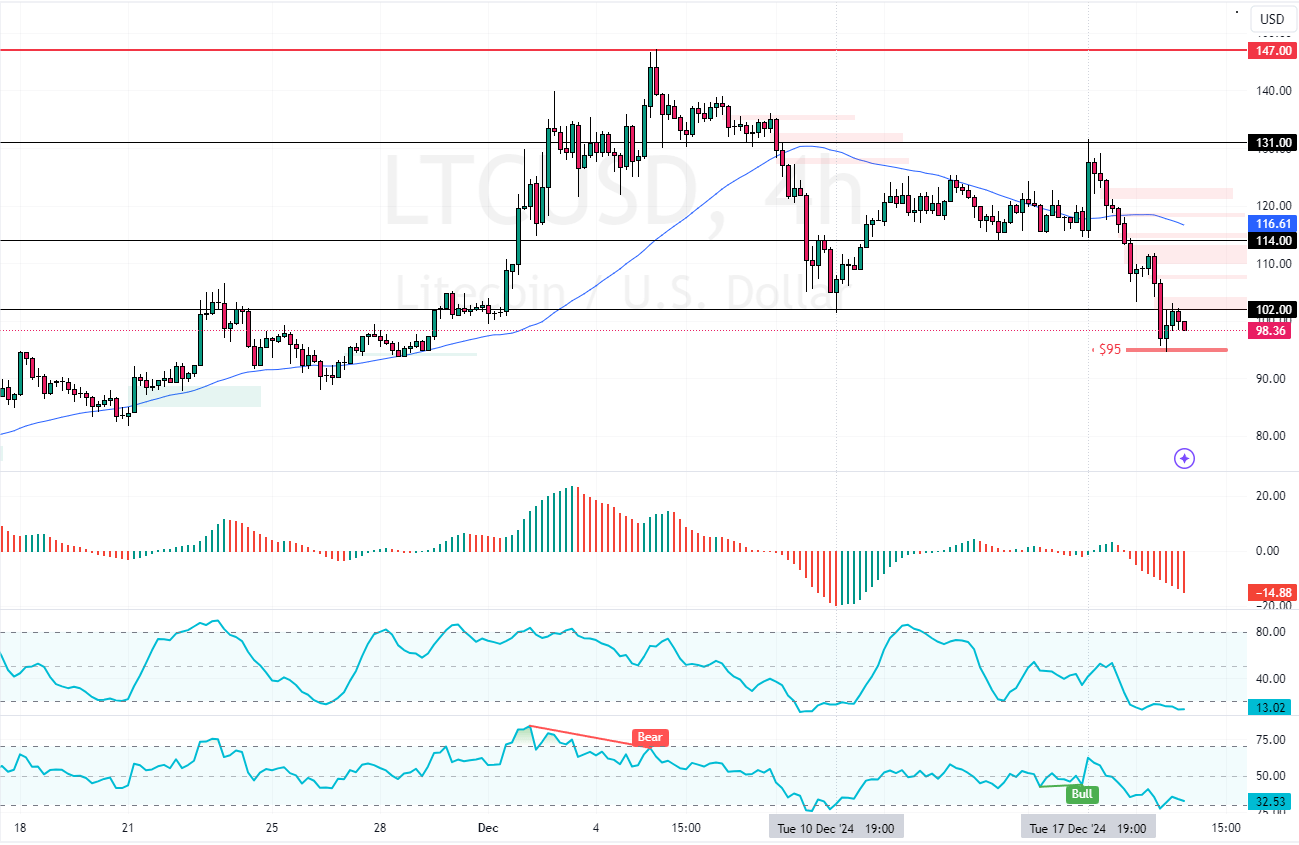
Litecoin dipped to $95 and lost 27% of its value in two trading days. The momentum indicators hint at an oversold market, creating opportunities for a pullback.
A close above $102 could raise prices toward $114, while a dip below $95 would trigger a downtrend.

Litecoin Technical Analysis – 20-December-2024
LTC began a bearish wave from $131.0. The selling pressure escalated as the price shifted below the 50-period simple moving average. As of this writing, Litecoin trades at approximately $97, continuing its bearish trajectory by losing 1.6% of its value today.
Interestingly, the RSI 14 and Stochastic Oscillators show readings of 32 and 12, respectively, indicating that the cryptocurrency is oversaturated with sellers.
Therefore, consolidation or a new bullish wave could be on the horizon. That said, going short at the current prices is not advisable.
Watch Liecoin for Sell Signals at Key Levels

Traders and investors should wait for the crypto to consolidate near upper resistance levels, starting with $106.0 followed by $114.0.
Monitoring these resistance levels for bearish signals, such as candlestick patterns, is recommended, as these prices offer a decent entry point for selling the cryptocurrency.
Please note that Litecoin’s bearish trend remains valid as long as the prices are below the 50-period SMA or the $114.0 resistance. That being said, the downtrend will be triggered if Litecoin falls below $95, targeting $88.0.