FxNews—Litecoin ranges in a bullish flag against the U.S. Dollar, trading at about $84 in today’s trading session. The primary trend is bearish, but the weak uptrend momentum began on April 14, trying to stabilize itself above EMA 50 and EMA 100.
Therefore, the current bullish momentum should be considered a consolidation phase that could extend further.
Litecoin Technical Analysis Daily Chart

The awesome oscillator and the RSI indicator suggest the market is neutral in the daily chart, showing 2.26 and 51 in value, respectively. On the other hand, the stochastic oscillator %K line declines, recording 58 in the value, meaning the market is losing momentum.
These developments in the technical indicators suggest the market is neutral and suffers from a lack of momentum. When a trading instrument is in such a situation, traders and investors usually wait patiently for the price to gain momentum on breakouts. Therefore, we will zoom into the 4-hour chart for a detailed analysis and find critical levels and trading opportunities.
Litecoin Technical Analysis 4-Hour Chart

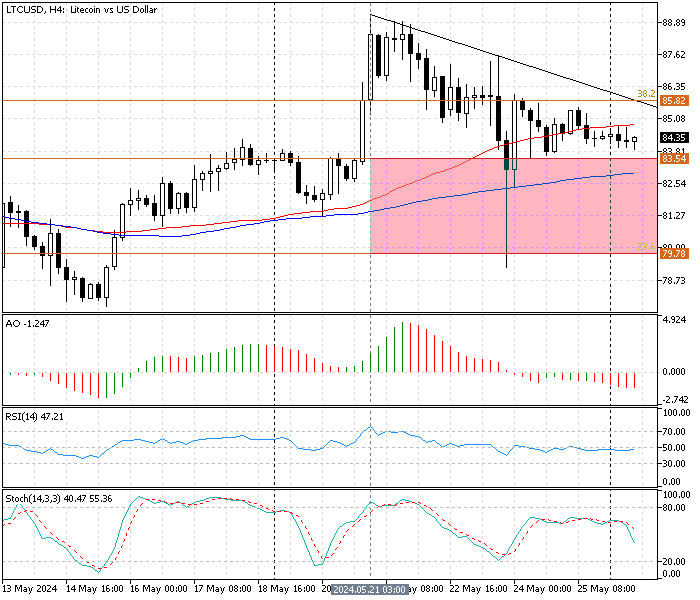
The LTC/USD pair has been trading sideways below the descending trendline and above the immediate resistance at $83.5. The tiny size of the candles implies low momentum.
- The RSI (14) value is 45, moving side by side to the 50 line horizontally, indicating the lack of trend in the LTC/USD pair.
- The Stochastic oscillator value is not overbought or oversold territory; it is 38, representing low volatility.
These developments in the technical indicators suggest Litecoin trades sideways in a low-momentum market. At the same time, the primary trend is bearish, with the awesome oscillator bars in red and below zero, depicting -1.24 in the description.
Litecoin Sideway Market – What to Expect Next

From a technical standpoint, immediate support is $83.5. Furthermore, Litecoin is below the descending trendline (in black in the image above), and the awesome oscillator bars are red below the signal line. The recent selling pressure, which began on May 21, will likely extend to the 23.6% Fibonacci retracement level at $79.7 if the bears maintain their position below the descending trendline at about $85.
Important Notice: The $79.7 is a robust support area because it is backed by the ascending trendline (shown in the daily chart). Litecoin also bounced more than eight times in May from $79.7. That said, analysts at FxNews suggest monitoring this supply zone if the price dips to this level.
Litecoin Bullish Scenario

Immediate resistance is the 38.2% Fibonacci retracement level at $85.8. The bearish outlook should be invalidated if the bulls cross and stabilize the price above the immediate resistance. If this scenario comes into play, the new bullish wave could target the upper band of the bullish flag at $95.5, a resistance backed by 61.8% Fibonacci.
Key Support and Resistance
Traders and investors should closely monitor the LTC/USD key levels below to make informed decisions and adjust their strategies accordingly as market conditions shift.
- Support: $83.5, $79.7
- Resistance: $85.8, $89.1, $95.5