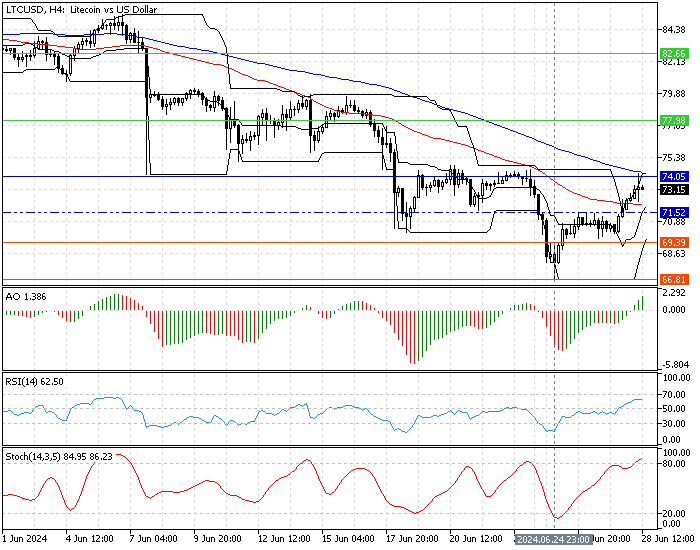
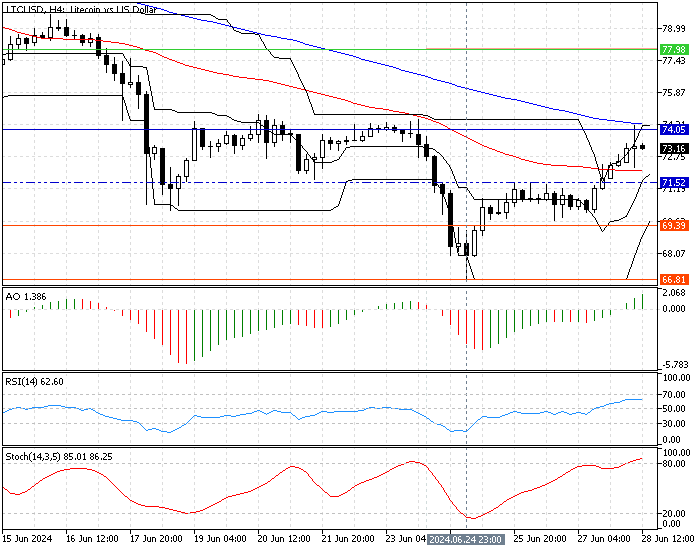
FxNews—Litecoin rose from its June 24 low of $66.8 as expected because the stochastic oscillator was in oversold territory then. As of writing, the LTC/USD pair traded at about 73.3 and tested the pivot point at $74.
The 4-hour chart below demonstrates Litecoin’s current price and the key technical levels and tools utilized in today’s analysis.

Litecoin Technical Analysis – 28-June-2024
The bears formed a doji candlestick pattern in the 4-hour chart in today’s trading session, meaning the current bullish momentum is exhausting. The technical indicators in the Litecoin 4-hour chart suggest that the current uptrend is strengthening, but Litecoin might be overvalued against the U.S. dollar.
- The awesome oscillator value is 1.39, with green bars above the signal line. This development in the AO value signifies the bull market prevails.
- The relative strength index is above the median line, showing a value of 63 in the description, suggesting the uptrend could resume and the market is not overbought yet.
- The stochastic oscillator’s %K line is in the overbought territory, recording 86 in the description. This signals an overbought market, which could result in the Litecoin price dipping from this point.
Litecoin Price Forecast – 28-June-2024

The primary trend is bearish because the LTC/USD price is below the pivot point and the 100-period simple moving average. Interestingly, the 4-hour chart formed a doji candle stick near the pivot point, meaning the bears added pressure to the market.
Hence, from a technical standpoint, if the Litecoin price holds below the pivot point at $74, the primary trend (bearish) will likely resume. In this scenario, the bears (sellers) could initially target the immediate support at $71.5. Furthermore, if the selling pressure drives the price below $71.5, the next supply zone will be at the $69.3 support.
Likeway, the 100-period simple moving average is the critical resistance for the bears. If the price exceeds this level, the bearish scenario should be invalidated.
Litecoin Bullish Scenario
The awesome oscillator and RSI (14) signal that the bullish trend should resume. However, the pivot at $74, backed by the 100-period simple moving average, has held the LTC/USD price higher. For the bullish wave from $66.8 to continue, the bulls (buyers) must close and stabilize the price above the pivot.
If this scenario unfolds, the next bullish target could be $77.9. It is worth noting that $71.5 is the immediate support for the uptrend. Should the price dip below this level, the bullish scenario should also be invalidated.